Do you chase a stock that is already up 12% on the day? What do you do when one of the your stocks announces an earnings warning? What do you do when one of your stock positions announces an SEC investigation and after a pleasant up-trend, it crashes and goes the other direction? Or a company you own announces a huge new surprise contract, reversing its down-trend, gaps up, continues higher. Will prices bounce right back after the news is digested? These situations baffle most investors. However, having the knowledge of Candlestick formations provides huge advantages. The formation that the price move creates is an important function of how to profit from that price movement.
Big dramatic moves! What do you do? Many investors act like deer in the headlights, do nothing as most advisors suggest. But Candlestick analysis tells you instantly what to do. An announcement can completely reverse a trend direction. For example, if a trend has been in progress, whether strong or mild, and a surprise announcement occurs, how that formation rolls out will tell the investor what to do. One viable possibility is observing the previous day’s candle formation, with the open price, then the closing price continuing in the direction of the existing trend. After the announcement, the price alters its direction, opening at the same level as the previous day, a gap open, and proceeding to close in the complete opposite direction of the previous day. This is known as the Kicker signal. It is a high-powered candlestick signal. This signal should never be ignored. It can create huge easy profits.
The Japanese rice traders identified approximately 50 reversal and continuation signals through their centuries of developing candlestick signals. Of these, about 8 major signals will provide more trades than most investors will ever need. We put the Kicker signal in the category of a “major” signal because the results created from the aftermath of the Kicker.

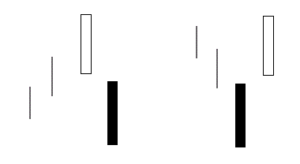
Kicker Top and Kicker Bottom Formations
The Kicker Signal is the most powerful signal of all. It works equally well in both directions. Its relevance is magnified when occurring in the overbought or oversold areas, but is effective no matter where it appears in a price trend.
Consider the investment sentiment that formed this pattern. It is formed by two candles. The first candle opens and moves in the direction of the current trend. Investors are continuing with the established trend, closing the price further in the existing direction. Then, something has occurred to violently change the direction of the price. Usually a surprise news item is the cause of this type of move. The signal illustrates such a dramatic change from the current price direction that the new direction will persist with strength for a good while. (There is one caveat to this signal. If the next day prices gap back the other way, liquidate the trade immediately. This does not happen very often, but when it does, get out immediately.) The second candle opens at the same open as the previous day, a gap open, and heads in the opposite direction of the previous day’s candle. The bodies of the candles are opposite colors. This formation is indicative of a dramatic change in investor sentiment. The candlesticks visually depict the magnitude of the change.

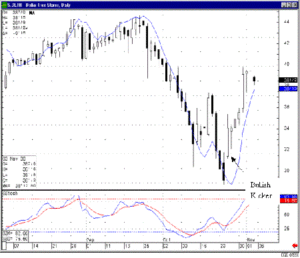
DLTR, Dollar Tree Stores
Due to the change being so dramatic, and the initial reversal effecting a large percent of the price, the trend usually persists in the new direction for an extended period of time. First, the news report takes investors by surprise. The people that heard it from the time it was reported bailed out on the open. Others will hear about the news later, making their investment decisions during the next day or so. Others may not hear about it for a week or so. If it is bad news, the overhanging supply keeps weighing down the price for a few weeks. If it is good news, it will take a good while for the enthusiasm to wane. These moves can usually be substantial, especially if it is moving in the same direction as the market in general.
The Kicker Formula
The Kicker Signal is can be easily formulated for search purposes. The position of the signal, in a trend, is not important. The important factor is that a severe change in investor sentiment has occurred. Because the Kicker signal is a two-day signal, two opposite elements are required. First, in a Bullish Kicker Signal, the predominant trend should have been downward. The first day of the signal would have opened, traded down, then closed lower than where it opened.
(O1 > C1)
Day two should have opened equal to or above the open of day one and then closed higher than the open of day two.
AND (O => O1) AND (C > O)
Do not let the magnitude of a kicker reversal signal deter you from making the trade. The announcement or event that created the Kicker signal in that stock is not going to be a one-day affair. It has reversed the direction of investor sentiment. That was the surprise in which the investment community reversed its outlook. The big percentage move, that first day before you got in, is just a small part of the rest of the move.
Many investors will mistakenly wait for the price to pull back so that they can get in. The candlestick investor does not want to see a pullback. The buyers should maintain their buying to make this trade a strong one. To wait for a pullback is not the buying pressure that you would want for a strong up-move stock.
The Bearish Kicker Pattern has the opposite formulas. Of course the trend should be in a predominantly upward direction. Usually a bad news announcement will send the stock price crashing. The formula should be.
(O1 < C1)
The open on the following day is equal to or lower than the open of the previous day and continues down, closing lower than the open.
AND (O <= O1) AND (C <= O)
The more overbought when the signal started, the better. Again, the magnitude of the reversal is directly related to the strength that should be conveyed in the remaining portion of the new trend. Do not be afraid to participate in the move despite the magnitude of the initial move. Because the news was a surprise, it will take at least a few days, if not much longer, for the investment community to digest and assess the ramifications of the surprise.
Candlestick Advantage
Knowing what a candlestick signal looks like creates tremendous profit making advantages. If a surprise announcement occurs, the Candlestick trader can take advantage of the price movement immediately versus waiting to see what direction the trend will evidentially take. These opportunities will happen almost every day. Having the proper search criteria provides a constant supply of highly profitable trades. In a universe of 9,900 stocks, it is likely that one or two will have a surprise external event that will drastically alter the perception of the future of those companies. Violent price moves usually leave investors in their tracks. Having the foresight of what candlestick signals can be forming creates great opportunities to make big profits. Somebody is taking advantage of the big profit situations. No reason it can’t be you.
Training Tutorial available on The Kicker Signals
Speak Your Mind