Stock market crashes – forewarned by candlestick signals.
Stock market crashes are the major fear of most investors. The “what if” scenario. What if I am fully invested and the stock market crashes. Fortunately that fear can be eliminated with candlestick signals. Most investors have the fear of stock market crashes such as we saw in 1929. There have been some substantial stock market crashes in the past 20 years. These stock market crashes had a different result. The general public were the ones trying to get in at the bottoms while the institutional investors were bailing out, trying to save their investment record.
Stock market crashes do not necessarily need to be feared. Using candlesticks signals, all stock market crashes are foretold by candlestick signals. Stock market crashes do not occur unexpectedly. The stock market crash of 1929, which had its major selling occur in October, actually started selling off in August. The stock market crashes in the past 20 years revealed definite candlestick sell signals prior to the big selling day’s. These stock market crashes should not be feared. A candlestick investor, utilizing the signals, can be prepared by not only being out of long positions, but short positions can be put in place. Having the ability to identify what the market trends are doing will eliminate an investor’s apprehension about a possible market crash.
The major advantage of candlestick signals is that they identify investor sentiment in a market trend. The stock market crashes usually occur at the end of those sustained downtrends. The big selling days do not occur as a surprise. Not only to the candlestick signals reduce the apprehension about being in the stock market, they allow an investor to be positioned in the stock market either long or short to take advantage of the current trends.
Market direction
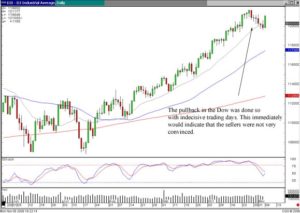
The over all trends of the markets can be easier to evaluate when using the candlestick signals. As seen in the current Dow chart, the Dow appears to be in an uptrend. The past few weeks have revealed a pullback. The same type of pullback that appeared in late February into early March. The trend channel can easily be seen. The conditions of the stochastics are also easily recognized. Monday, the Dow formed a strong Inverted Hammer signal, with the stochastics getting close to the oversold condition. What should happen to confirm an Inverted Hammer signal with stochastics getting near the oversold condition? A bullish day the next day. This would confirm the signal as well as conforming with the uptrending movements of the Dow.

DOW
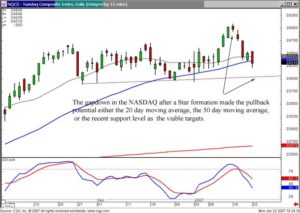
The NASDAQ is showing sell signals. A Doji, followed by a Spinning Top, followed by a Bearish Engulfing signal with stochastics starting to curl down reveals a possible pullback in that index. What formations are forming in the NASDAQ? A Fry Pan Bottom! Will the Fry Pan Bottom formation be violated with a few days of a pullback? Definitely not. Also, the stochastics do not reveal any dramatically over bought condition.

NASDAQ
The NASDAQ pulling back for the next few days and the Dow picking up strength over the next few days would be the exact opposite of what has occurred in these indexes over the past week or so. This would be more confirmation that the markets are in slow uptrends. As one is selling off, the other is picking up strength. This indicates that there is not any massive selling. The sectors are just rotating.
The portfolio should be predominantly long but anticipate moving from sectors that are topping out into sectors that are picking up strength.
Speak Your Mind