The Elliott Wave Theory
The Elliott Wave Theory was named after an accountant named Ralph Nelson Elliott and he concluded that the movement of the stock market can be predicted through observing and identifying repetitive patterns of waves. This theory bases these market movements on crown behavior, now referred to as the psychology of investing and trading. He determined that crowd’s behavior can be predicted through analyzing wave patterns.
His theory is based on the rhythms found in nature. What this means is that it is suggested that the market moves in the direction of the main trend and that trends are reflected in a five series of waves called impulse waves. Additionally, there exists a series of three corrective waves that move against the trend. (See trend trading). The difference between the Elliott Wave Theory and other similar theories is that his theory suggests that there is not absolute time requirement for these cycles to complete however both the corrective and impulse waves can be seen in long-term and in short-term stock charts.
These waves can also be further broken down into more waves as it relates to Fibonacci numbers. Traders will use Fibonacci indicators as reference points when trading, to predict a retracement versus a reversal. Fibonacci indicators provide an excellent visual map and are extremely accurate when analyzing chart pattern reversals.
There is a very high degree of subjectivity when looking at Elliott’s theory and as a result it is very difficult to find agreement among stock traders. The main disparagement deals with the waves and the fact that it is difficult to tell when a wave begins and when it actually ends. There are no real clear definitions however, the stronger the impulse wave is the stronger the corrections will be. Of course, the weaker the impulse wave is the weaker the correction wave will be as well.
Confirmation when using the Elliott’s theory deals with oscillators and divergence. The Elliott Wave oscillator can be used to choose highs and higher lows in an uptrend and also lower highs and lower lows in a downtrend when helping to confirm proper entry and exit points. Additionally, this theory used divergence between the oscillator and the price for confirmation.
There are so many different technical indicators to use when stock trading that it can be overwhelming. Just be sure that you explore and have an understanding of the basics of the most popular and widely used methods, and then focus on a couple of technical analysis methods that you can use together. Don’t try and use them all or you are causing yourself undue stress. Just become and expert on two to three and use them in your every day trading.
Candlestick signals and formations are extremely powerful for detecting when investor sentiment has changed. The reversal signals clearly illustrate that a change of investor sentiment is occurring. Conversely, the opposite is true. Candlestick analysis allows for the evaluation of a trend as to whether that trend is continuing in its current direction. This may be a very simplistic statement. However, it is a very beneficial tool for investors. Many investors allow their emotions to let them to be whipsawed during a trend. If you understand what is required to change a trends direction, you become much more comfortable during the countermoves of a trend. This morning’s trading was a clear example.
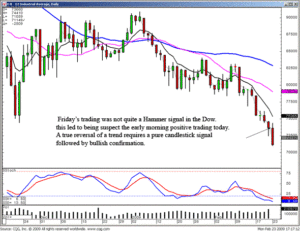
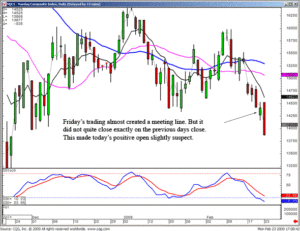
With stochastics in the oversold condition, the Dow and the NASDAQ formed “almost” reversal signals on Friday. The Dow formed a Hammer type signal but did not quite reach the requirements of a pure Hammer signal. The tail was not quite two times the body. The NASDAQ formed a potential Meeting Line signal. However, the close of Friday did not quite close exactly on the close of Thursday. These formations, although relatively close to being potential reversal signals, were not quite reversal signals. These become very important factors when deciding to cover short positions or not. The fact that they were not pure candlestick reversal signals instigated one more requirement. Todays trading needed to show strong bullish confirmation. The markets started out positive this morning but did not move to the degree that would indicate the Bulls had taken over.

DOW

NASDAQ
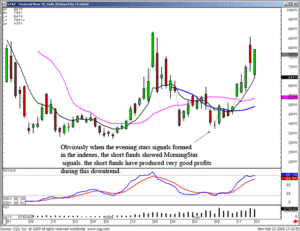
The downtrend had to be considered still in progress until there was an indication of a strong reversal of investor sentiment. After the Spinning Top formed on Friday, the NASDAQ had the potential of reversing. It gapped higher on the open but immediately started selling off. Had the buying continued after the open, that may have warranted covering short positions. The decision for closing out short positions or selling the short funds did not become an issue as the continued selling proceeded during the day. The lack of a candlestick reversal signal allows for comfortable participation in the market, being heavily oriented toward the short side. As often professed in these newsletters, let the market tell you what the market is doing. Currently, there has not been any indication that the current market sentiment has changed.

FAZ Short Fund
Candlestick Forum Online Boot Camp – last call – The boot camp training will start tomorrow at 4:30 PM ET. The next four weeks will consist of one hour training sessions on Tuesday and Wednesday afternoons. These concentrated training sessions will deal with one specific topic each day. Each topic will be oriented toward the weaknesses most investors encounter in their investment endeavors. The information provided is information that most investors have never been exposed to. They are aspects of investing that all investors are aware of, they just have not been studied in detail. If you want to take the subjectivity out of your investment thought processes, sign up today for a very detailed, step-by-step investment process that allows each investor to gain control of their own investment abilities.
How do you take the emotions of investing? By understanding each aspect of the investment process in full detail. We all have our weaknesses. Some people have a hard time getting into a position at the right time. Some people have a hard time cutting their losses. Some people have a hard time taking profits. Simple money management techniques eliminate many of the emotional problems. Candlestick analysis is a common sense investment process that allows each investor to control their own investment acumen. Do not miss this opportunity to learn how to trade effectively for the rest of your life.
Chat session tonight at 8 PM ET members only.
Good investing,
The Candlestick Forum Team
This Week’s Special
Fast Track to Trading
The 12 Major Signals and 5-Star Trading package Combined
Learning to make your own investment decisions is easier than you think!
Click here for details
Website special reflects current newsletter. If you are reading an archived newsletter you will be directed to Current Website Special
Speak Your Mind