The ability to analyze factors affecting stock market movement provides an additional advantage for being able to evaluate the direction of the markets. Those factors are not hard to find. They are usually what are being reported on the financial news stations. Recently, Crude Oil has been an influence. Also, the decline of the US dollar has become a factor.
The Candlestick signals provide the insights on how the outside influences will affect the Dow and the NASDAQ. The US dollar has formed a few Doji’s when the stochastics were in the oversold condition. There may be an opportunity for a rally in the dollar over the next few days. There appears to be some strength being shown after the Doji’s. If this is one of the factors that is affecting the stock market, having a better visual concept of what one of the influences is doing makes for a better evaluation.
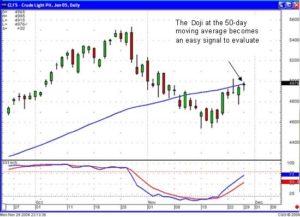
Crude Oil prices, after their decline from the $57 range down to the $46 range, provided strength to the stock market indexes. As anticipated, with the stochastics in the oversold condition, Crude Oil prices bounced back up to the 50-day moving average after it had broken down through that level. Currently, the January futures contract of Crude Oil has been hugging the 50-day moving average. It formed a Doji on Monday, right at the 50-day moving average. This now becomes an easy evaluation. A bullish day after the Doji would send prices up through the 50-day moving average, indicating that the 50-day moving average is not acting as resistance. On the other hand, seeing the Crude Oil prices heading lower after the Doji would reveal that the 50-day moving average was now acting as resistance and it would be feasible to see new recent contract lows in the near future.

Crude Oil
Taking these outside factors into account, it becomes easier to analyze which way the market might go based upon the factors affecting stock market movement. Use the candlestick signals to your advantage no matter which market you are analyzing.

Rising Three Method
Description
The Rising Three Method is an easy pattern to see during uptrends. A long white candle forms. It is then followed by a series of small candles, each consecutively getting lower. The optimal number of pull-back days should be three. Two or four or five pull-back days can also be observed. The important factor is that they do not close below the open of the big white candle. It is also preferred that the shadows do not go below the white candle. The final day of the formation should open up int he body of the last pull-back day and close higher than the first big white candle.
Criteria
- An uptrend is in progress. A long white candle forms.
- A group of small-bodies candles follow, preferably black bodies.
- The close of any of the pull-back days does not close lower than the open of the big white candle.
- The final day opens up into the body of the last pull-back day and proceeeds to close above the close of the first big white candle day.
Pattern Psychology
The Rising Three Method is considered a rest in the trend or, in Japanese terms, a rest from battle. The concept is that the first black candle day brings some doubt into the bull camp. The next day does the same. By the thrid day, the bulls ar now convinced that the bears do not have the strength to push prices down anymore. The bulls get their courage back and start stepping in. The pattern resembles the Western bull flag or pennant formation, however, the concept was originally developed in the 1700s. In modern terms, the market was just ‘taking a breather”.
Speak Your Mind