How to Determine Your Hedging Strategy
To determine your strategy of choice when hedging you must first understand what a hedge fund is. This fund is an unregulated investment pool of capital for wealthy individuals or institutions that employ one of various investment strategies in attempts to gain from market inefficiencies. Fundamental and technical analysis are both used to hedge underlying risks.
When reading about the various strategies below keep in mind that many investors will use a combination of strategies rather than just one strategy. The strategies are very different and they require different levels of borrowed money. That too should assist you when deciding what strategies you would like to utilize. While there are about 14 different hedging strategies available to investors, in today’s article we will discuss handful of them.
Hedging Strategy #1 – Dedicated Short Bias
This strategy happens when the fund continuously shorts stocks it doesn’t own with the expectancy of a decline in value. The fund should perform contrary to the stock market with tremendous results and with funds having high returns when the market goes down and vice versa.
Hedging Strategy #2 – Fixed Income Arbitrage
This strategy uses bonds in a variety of different ways. One example includes the shorting of bonds of higher credit companies. The proceeds are then used to buy bonds of lower credit companies. The idea is that the Bond Confidence Index will move toward 100 and the lower quality bonds will outperform the higher quality bonds.
Hedging Strategy #3 – Market Timing
This strategy is typically based on technical factors (technical analysis) such as price, volume and market sentiment and it is short-term in nature. The goal of this strategy is to buy a financial asset with the expectation that the asset will increase in value.
Hedging Strategy #4 – Aggressive Growth
This strategy deals with investing in stocks that have a high potential for growth due to strong earnings growth or sales. Investors must understand the concept of Standardized Unexpected Earnings (SUE) in order to practice this from of hedge fund investing. This form of investing deals with the buying and selling of stocks in companies that have reported earnings either above or below estimates made by analysts.
Hedging Strategy #5: Opportunistic
This strategy is a tricky one and depends on the judgment of a portfolio manager. Basically, a fund manager rotates among all possible strategies with it depending on the point of view associated with a particular investment strategy at a specific point in time.
There are many additional strategies for hedging that are available to investors. Strategies such as the managed futures strategy, the sector specific strategy, the market neutral strategy, and the emerging markets strategy should all be considered. While this article does not explain these additional strategies this does not take away from their importance. Each investor should continue to study and learn as much about hedging as they possible can and they should also continue to research and find out which investment strategies work for them.
For additional help with investing, please continue to read additional articles located on the Candlestick Trading Forum site. There are many additional resources available to assist you so that you are on your way to successful investing!
Market Direction
Utilizing the premarket futures is a valuable tool when using candlestick signals. It allows for the preparation of establishing positions based upon the confirmation of the expected price trends of the markets. What do we want to see after a Doji in an oversold condition? Bullish confirmation the next day, to indicate a reversal has occurred. Each individual candlestick signal has some simple rules as to what to expect the following day. This makes establishing stock positions relatively easy. If we see a bullish candlestick signal in the oversold conditions, what do we want to see as confirmation the next day? The Bulls are still participating! Each morning the premarket futures can be easily seen on CNBC or Bloomberg. If we are anticipating the market is in an uptrend, and a buy signal potential has been found in a specific stock, the premarket futures will give a good insight into what is occurring in the general market sentiment before the open. If we see the premarket futures for the Dow and NASDAQ are positive, we are better prepared to establish a position in a stock based upon the confirmation of our buy signal.
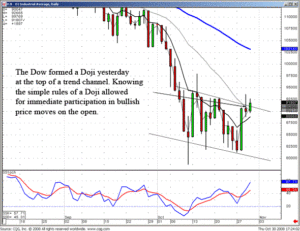
Yesterday the Dow formed a Doji. Was that indicating the top of the trend channel was going to act as resistance? Because of the simple rules applied to a Doji, trading actions the next day are very simple. A trend is usually going to move in the direction of how the markets open after a Doji. Thursday morning, the premarket futures showed very strong bullish sentiment. Any potential buy signals that were discovered in our scanning techniques the previous night would probably be confirming after the market opened Thursday morning. This would allow investors to immediately start purchasing those positions. This is not sophisticated investment techniques. It is merely participating in the common sense applications of what the candlestick signals are revealing.

DOW
It also allows for non-emotional covering of existing positions. Until the last few days, it has been recommended to carry some short funds in the portfolio. This was acting as a hedge for any severe downdraft in the market. However, upon seeing the premarket futures showing great strength when the indexes were in the oversold condition allowed for immediate decisions on the open. Those positions could be closed as soon as the market opened and the funds could be reallocated to confirming candlestick buy signals. Investment strategies should not be difficult. What becomes difficult for most investors is knowing which direction the market is moving. The use of candlestick signals makes that assessment much easier. Therefore, an investor is much better prepared to take advantage of price moves at their initial reversals.
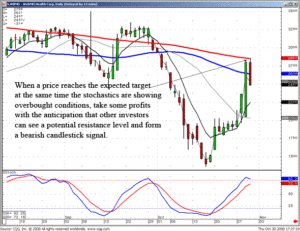
The development of candlestick signals at specific support and resistance levels provides a much better analytical tool than most technical trading methods. It shows exactly what is going on in investor sentiment when those levels are reached. As illustrated in WBMD, the 200 day moving average was a potential target. Stochastics were moving into the overbought condition. As the price move to the 200 day moving average, we took some profits. Why? Because the price was heading toward the overbought condition. And it reached a potential target, the probabilities of a candlestick sell signal became much greater. With those conditions setting up, the anticipation of a candlestick reversal signal will make an investor much more diligent.

WBMD
Why do most investors not take profits when the probabilities say they should? Because they do not want to look stupid. They do not want to sell a stock at $28.50 and watch the stock continue to $45. Boy, would we look stupid! The benefit of knowing what candlestick signals can occur under specific conditions makes taking profits much easier. For those that are afraid they might look stupid, a very simple selling procedure can be applied. When the price moves to a projected target, that target was anticipated based upon the expectation that when it reached it, it would now be in an overbought condition. That process alone is the result of knowing when to buy based upon candlestick signals. Being in the right direction at the right time is difficult for most investors. Being in the right position and projecting a potential target is more difficult. When it gets there, what happens in most investors thought processes? Boy, if I was smart enough to figure out when to get in and what target it could potentially reach, this pick of mine could even go much further. Egotism starts to overplay rational evaluation.
Unfortunately, the euphoria of making big profits and being correct starts clouding rational thinking. This occurs in most all investors. What is the remedy? If the fear of selling too soon is so great that it paralyzes the rational thought processes, closeout half the position. That makes the next decision process that much easier. Today when WBMD reach the 200 day moving average, closing out half the position put a good profit back in the account. Now the decision-making process becomes easier to contend with. Had the price continued above the 200 day moving average, our mind would be able to rationalize that we were still holding one half of a position that was continuing to make profits. This was being done in a high risk area, the overbought condition.
On the other hand, the Bearish Harari that formed after the 200 day moving average was touched would have had us closing out the other half of the position. If we had not taken half the position off at the 200 day moving average, we would have chastised ourselves for not taking profits when the target and the stochastics showed a high probability that we had reached the top. How stupid we would have felt knowing we should’ve sold at the $28.50 level when we finally closed out the of the $25 level. But selling half the position at $28.50 and the other half at $25, we now can rationalize to ourselves that we got an average around $27, or most of the profits from this trade.
The best investment trading method in the world will not work properly if it is not applied correctly. Candlestick analysis greatly improves an investors ability to handle their own emotional flaws. These aren’t arm’s-length words of wisdom. This is from the learning process of somebody that has spent 30 years in investing and needed to find ways to overcome the emotional faux pas of investing.
Chat session tonight 8 PM ET – Click here for instructions, or if you already have HotComm installed, click here to connect.
Good investing,
The Candlestick Forum Team
Website special reflects current newsletter. If you are reading an archived newsletter you will be directed to Current Website Special.

Speak Your Mind