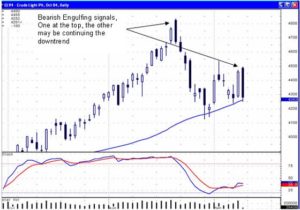
Oil prices are still having an effect on the market trends. However what used to be a potential damper on the DOW’s and NASDAQ’s upward movement might now be a stimulant. Crude oil future prices showed signs of bouncing off the 50 day moving average this past week but on Friday, the crude oil chart formed a bearish engulfing pattern. A lower open on Monday may indicate that the consolidation. At the 50 day moving averages over and may be ready for its next down leg. If we see that occur, that could be adding strength to the market indexes. Candlestick charts make this analysis very easy.

October Crude Oil
Note the distinctive Bearish Engulfing signal three weeks ago. The pullback came back exactly to the obvious support, the 50 day moving average. At that point, the stochastics were in the oversold condition when witnessing the doji forming right on the 50 day moving average. From there it acted as a support level for crude oil prices. However, on Friday the bearish engulfing signal, although it came right back to the 50 day moving average, might indicate further weakness in oil prices if we see a weak trading day on Monday. A breach of the 50 day moving average could make the next target at the 200 day moving average at the $35.60 area.
Oil prices declining to $36 a barrel would put some new life in the stock market indexes. This past week the semi-conductors charts revealed a very strong reversal signal. The majority of the stocks in that sector have been in a steady decline for the past few months, some giving up more than half their price value. As mentioned in the morning comments area this past week, when a large number of charts, all in the same sector move with the same patterns, especially with gap ups following major reversal signals, it is a sign that the whole industry has had a dramatic change in investor sentiment. The gap-up buying indicates that a lot of force has entered the positions. Review our recommended list and study the semiconductor charts in general. The best time to participate in profitable price moves is when the moves are just beginning. The initial buying is now being hampered by any profit taking until higher levels.
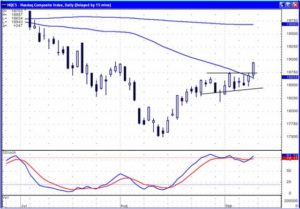
Market Direction – For the past week or so, the moving averages have come into play in the recent market trends. The NASDAQ spent a week trying to come up through the 50 day moving average. Although it had some weak signals as it approached the 50 day moving average, it never had any trading to the downside that confirmed the weak signals. You’ll note in the NASDAQ chart that although the stochastics were pulling back, the price movement traded relatively flat. This was a sign that a consolidation period was in affect versus a reversal. The trading of Thursday and Friday turned the stochastics back in upward direction. The close above the 50 day moving average on Friday, with stochastics facing up, should now give us the potential target of the 200 day moving average. Remember, that is now a potential target, the signals should reveal if and when that target might be hit.

NASDAQ Response to Oil Price Change
Note how the stochastics showed a downward bias after coming up to the overbought area while the Nasdaq prices held fairly steady. As you may have seen in the market comments through this time period, it was recommended to have a mix of both long and shorts until the trend of the market could be identified. The trading of Friday demonstrated what the investor sentiment was going to be when testing the 50 day MA. Anticipate more days to the upside.
Likewise, in the Dow chart, prices came up through the 50 day moving average. For a couple of days, it pulled back, but did a hammer signal on Friday. This revealed that they did not want to close at below the 50 day moving average. The next resistance should be the trend line coming through the tops of the trading in April and June. A close above the June top would indicate that the slow waffling downtrend may be turning into an upward trend.
Speak Your Mind