Learn Candlestick analysis in order to enhance trading profits, buy stock and sell stock at optimal stock prices, and trade commodities, futures, and options more profitably. Traders learn Candlestick analysis in order to reliably predict stock price movement when trading stocks or commodity price movement when trading oil futures, gold futures, or corn futures. Options traders learn Candlestick analysis in order to predict price movement of the underlying equity when trading options as well. Candlestick analysis is derived from the insights of rice traders in Japan three centuries ago. Traders realized that there were repeating patterns in the price of that commodity. The patterns predicted whether the price of rice would go up, down, or stay the same. Because Candlestick patterns are displayed as a visual symbol they can be easier to follow compared to follow and understand than many technical analysis charts. Training in classes such as Candlestick Forum Boot Camp is a good way to start with Candlesticks and a good way to begin making profits from trading stock.
Traders learn Candlestick analysis in order to profit from trading stocks. Learning such patterns as the Doji or Bullish engulfing pattern will help the trader to profitably anticipate price variations. The old saying is that Candlesticks let the market tell the trader what the market will do. This is technical analysis in which the trader knows that all of the important fundamental analysis of the market is already known and that what makes a profit is successfully anticipating the sum of the actions of other traders. Traders can learn Candlestick trading tactics in online training webinars in order to enhance their basic stock market training. To learn Candlestick analysis is to learn a time honored system that has helped traders for centuries. Learning the signals in Candlestick trading requires a degree of study and a degree of practice. Taking an online class is an excellent idea because of the opportunity for the kind of give and take that speeds up the learning process.
Candlestick pattern analysis does not only work in trading stocks or commodities. It can also be useful in predicting price movement in buying calls and buying puts in options trading. By successfully anticipating a rise or fall in the price of the underlying equity a trader may be able to buy an out of the money option just before it becomes quite profitable due to the price movement of the underlying equity. As with trading stocks using Candlesticks, trading options successfully with Candlesticks relies on the fact that sound technical analysis reads the history of price movements and finds matches in current trading. Wise traders will profit from the difference between the strike price and spot price of a stock by letting Candlestick signals guide their purchase and sale of options contracts. The combination of leverage that options trading offers and the excellent ability of Candlestick signals to predict price movement is a great incentive to learn Candlestick analysis for profits in options trading as well as stock trading.
Market Direction
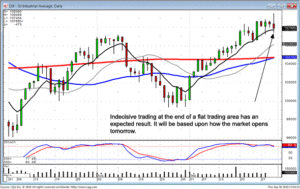
What is the most obvious candlestick signal? The Doji! It reveals there is investor indecision. The Japanese Rice traders have illustrated many times a reversal will occur after a day or more of indecision. Indecision was clearly evident in today’s trading. The indexes went positive very quickly during the day. They eventually came back down and tested the T-line. Early afternoon all the trading of both indexes move back into the positive territory. The Dow produced a type Doji. It produced a long legged Doji which illustrates bigger indecision. The fact that this Doji occurred at the end of a flat trading time frame has significance. It reveals the Bulls and Bears not knowing which way to move the trend. This indecisive trading makes tomorrow’s open a very revealing trend indicator.

DOW
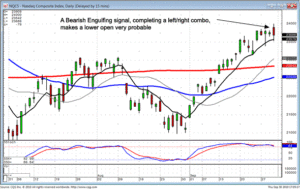
The NASDAQ formed a bearish engulfing signal after a small Doji the previous day. This also makes tomorrow’s open extremely important. A lower premarket futures would be an immediate indication to close out positions that should not be opening lower. It becomes a very easy process to analyze which charts are beginning to show weakness. A lower open would confirm the bears were taking control. This is not a difficult analysis. The candle formations clearly reveal whether the bullish force or the bearish force is becoming the stronger element.

NASDAQ
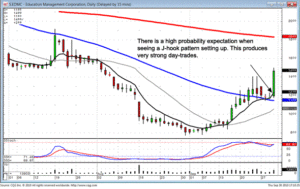
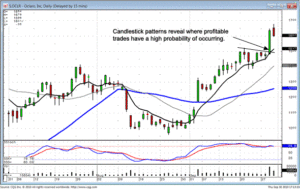
It should be reiterated that candlestick patterns provide a very powerful trading format. The investor sentiment has an expected result when these patterns start to perform. Although the market was relatively soggy after the initial open today, there were numerous Jayhook patterns providing excellent profits. A pattern is more likely to produce good results in spite of the general market direction.

EDMC

OCLR
The inherent forces built into candlestick signals and patterns are the product of investor sentiment working consistently through the decades and centuries. Human nature will always be the same. To not take advantage of the probabilities built into candlestick signals is to put your investing at an immediate disadvantage. Take the time to understand what should occur after each signal or pattern and you’ll be trading in the same manner as very experienced traders.
Chat session tonight at 8 PM ET, everybody is welcome.
Good Investing,
The Candlestick Forum Team
Fall 2010 E-Learning Online Training Schedule
Options Training Course
October 16 & 17, 2010
Commodity Training
November 6 & 7, 2010
Boot Camp
November 20 & 21, 2010
Website special reflects current newsletter. If you are reading an archived newsletter you will be directed to Current Website Special.
Speak Your Mind