Live cattle commodity trading has been lucrative this last year in a bull market. Fundamental analysis of factors that influence the price of live cattle including the cost of feed, herd sizes, and weather is useful in live cattle commodity trading. So is technical analysis of the live cattle commodity market. Commodity and futures training will help you understand commodity prices and commodity futures in trading live cattle. Live cattle are cows from calf stage up to 600 to 800 pounds when they go to a feed lot to put on another 500 pounds or so and are called feeder cattle. Successful commodity investing in live cattle starts with a few basics.
Live cattle trade on the Chicago Mercantile Exchange as LC. Live cattle commodity trading is in lots of 40,000 pounds which translates to about 80 cattle. Prices are quoted per pound in increments (ticks) of $0.00025. Thus one tick comes to $10 (40,000 X $0.00025). As of this writing live cattle futures are trading at $95.075 for April settlement and as low as $90.425 for August settlement. These figures translate to around $3.8 million for a lot with movement of a dollar in price coming to $40,000 in profit or loss in trading commodities in live cattle. Technical analysis charts used in commodity trading are just as useful for live cattle futures as they are for stock trading, options trading or Forex trading. As in using Candlestick charting the use of technical indicators to evaluate market history tells traders what the market will do next.
The commodity market in live cattle derives information from a number of sources. Feed prices are critical to success in livestock management and to making a profit raising beef. When the price of grain/feed goes up ranchers often will cull their herds. This reduces their costs and reduces the supply of beef in the year to come for live cattle and in the months to come in case of feeder cattle. However, culling herds means slaughtering many animals and this brings a lot of beef to market all at once. This makes steak cheaper in the market and reduces the commodity price for feeder cattle and live cattle in the short term. When the winter weather on the Great Plains and Corn Belt is severe livestock numbers may not drop but the cold stress will slow weigh gain of animals, reduce profits for ranchers, and delay the amount of beef that will come to market. Successful commodity trading requires that you understand how ranchers operate and how herd size and temporary swings in beef supply will affect live cattle commodity trading.
Commodity trading software will help the beginning commodity trader. To get the most out of online trading software it is best to take Commodity and Futures Training. To keep current on herd sizes visit the Department of Agriculture’s Cattle on Feed Report. This routinely published document will tell you how many cattle there are in feedlots and how many “live cattle” there are, namely how many have been weaned and are up to 800 pounds and still feeding on grass. Live cattle commodity trading is dealing in a complicated commodity market that, in the end, feeds the nation. Commodities trading in cattle will always be there with profits to be made by those who assess the fundamental and technical analysis correctly.
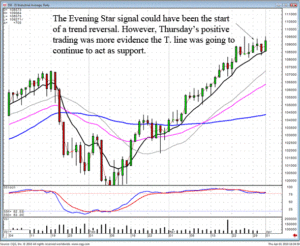
The effectiveness of the T-line in candlestick analysis can clearly be demonstrated watching the trend of the markets. Note how the Dow has used the T-line as support. Every time it moved away from the T-line, sideways trading brought the Dow back to the T-line. These past few days of trading saw the formation of an Evening Star signal. This could have been the beginning of a possible downtrend. However, one important factor was not fulfilled. As seen in Thursday’s trading, the Dow could not be pushed down through the T-line. This makes for one simple observation, the uptrend remains in progress. This may seem like a very simplistic method for analyzing a trend, but fortunately candlestick analysis is the process for making trend analysis easy. There is a simple rule. An uptrend will continue until there is a candlestick sell signal AND a close below the T-line. Without both of those parameters, the uptrend will usually remain in progress.

DOW
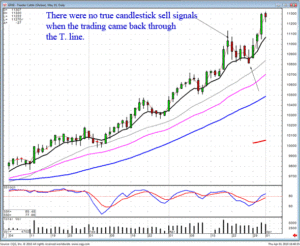
The same analysis can be applied to commodity trading. As illustrated in the May Feeder Cattle chart, the T-line provided a very compelling indicator. Note how the trading below the T-line revealed indecisiveness. Also note, the only solid close below the T-line during the uptrend was on March 28. This close did not follow a candlestick sell signal. Had the position been closed out, as it closed below the T-line, there would have been a much more compelling reason to buy back immediately as it gapped up and traded positive the next day. This would have been based upon some very simple trading rules. One, the longer an uptrend persists, the more compelling the candlestick reversal signal needs to be. Two, the lack of a candlestick sell signal followed by a close below the T-line should be considered more as a profit-taking stage versus a reversal. Three, the gap up the next day formed a mild kicker signal.

GFK0
The moving averages are very good support and resistance indicators. Commodity trading sees more activity around the T-line, the 20 day simple moving average and the 34 day exponential moving average, whereas stock trading sees much more activity around the 50 day moving average. Once you have learned which confirming indicators work well with stock trading, commodity trading, currency trading, or any other trading entity that involves fear and greed, you can utilize candlestick signals and patterns in all trading markets.
The combination of candlestick signals and the T-line helps an investor to decide when to get into and out of a position. It helps when holding a position. One of the greatest fears most investors have is giving back profits. Using the simple rules applied to candlestick trends keeps the emotions out of a trade.

May Soybeans
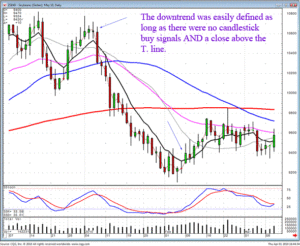
As illustrated in the May Soybean chart, the sell signal was quite evident: A Doji, followed by a bearish confirmation and a close below the T-line. The downtrend did not show any dramatic change of investor sentiment until buy signals occurred in the oversold condition, followed by a close above the T-line. As can be seen in this chart, there would have been many days where positive trading would have made somebody holding short positions very nervous. However, the candlestick investor would have had peace of mind, knowing the effects of the T-line.
Denver – Steve Bigalow will be providing a free presentation to the Denver trading club on Saturday, April 3. It starts at 9 AM and goes until 1 PM. There is a small room fee. It will be located at the Summit Event Center.
Join us if you can. Steve will also be arriving on Friday evening and meeting people for dinner at the Homewood suites hotel. Everybody will meet in the lobby at 6:30 PM if you would like to join Steve for dinner.
Chat session tonight at 8 PM ET.
Learn which sectors are performing well in the sideways market.
Good Investing,
The Candlestick Forum Team
Speak Your Mind