In today’s article we discuss general information and tips for investors when penny stocks trading. Penny stocks are low priced and speculative stocks of very small or very young companies. These types of stocks typically have market caps under $500 million, are priced below $5.00, and can also be referred to as over the counter stocks.
When penny stocks trading, there are certain things that you should keep in mind. These are explained below.
- Investors should look for positive single day movers with higher than average volume when investing money in penny stocks. They should also look for those companies that are developing new products, services, or technology as well as those companies that do well in the marketplace when compared to their competitors.
- Penny stock trader should also build a list of penny stocks (about 10 – 20) to focus on. This enables the investor to manage their portfolio and monitor their stocks.
- Take a look at the history of those penny stocks that you choose to trade. You can use stock charts, when penny stocks trading, in order to find stock chart patterns. Those stocks with a history of odd trading patterns will most likely not sell due to their unpredictability.
- Research the current financial status for those companies who you are going to invest in. Those companies that have either no debt or a small amount of debt, and those companies that show a pattern or increasing profit margins are good stocks to add to your list. Investors should also find out how many shares the company has in its float, and if the company’s product is patented. A patent will affect the consumer demand as well as the competition. If these things check out you may want to consider this company one of your best penny stocks.
- Stock traders can also find these stocks in the pink sheets and the Over the Counter Big Board (OTCBB). The companies listed here are typically new companies that are rolling out new products and once they are more established companies they will most likely move onto one of the other major markets. In fact, many of the stocks that are now traded on the major stock exchanges such as the NYSE were at one time listed on the Pink Sheets or the OTCBB.
There is a lot more to penny stocks trading and you should continue to do your research to find out if this is a market for you.
Market Direction
Understanding the results of patterns is vital for successful investing. There are two major reasons successful investors utilize trading patterns. First, it allows an investor to take advantage of what the market is doing right now. Being able to visualize what the current trend is doing dramatically improves the probabilities of profitable short-term trades. Secondly, it keeps an investor prepared for taking action at specific technical levels.
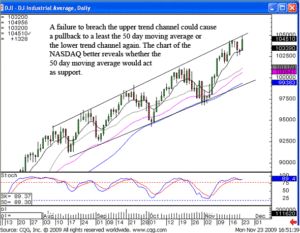
As viewed in the Dow chart, the short term trend has been pushing up against the upper trend channel. The longer-term trend has been using the 50 day moving average as a support level. The shorter term trend has been using the tee line as support. Today’s trading produced a Morning Star signal supported on the tee line. This obviously negated the bearish sentiment that could have been forming over the past two days of trading. The upper trend channel could be seen as a resistance level. Another test of the upper trend channel will have valuable information.
A failure of that level could produce another pullback. Would that pullback be to the 50 day moving average? That is where the first target area should be projected. Could the Dow finally break through the 50 day moving average and have a much stronger downtrend?

DOW
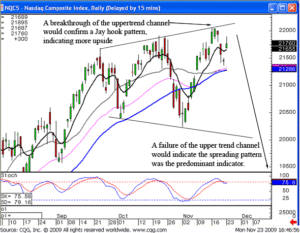
Analyzing the Dow by itself does not give the full picture of what is occurring in the overall market. The NASDAQ chart is showing a different downside potential. There are two factors that should be well noted. The past three tops in the NASDAQ chart had been exactly at the top of a trend channel. The exactness of that resistance level is usually a precursor to a possible hard selloff. There is another factor that should be added to the analysis. The NASDAQ has been forming a Spreading Formation. A failure of point 5 could start a very powerful down move. It will be important to see what type of candlestick signals occur as the top of the trend channel is tested again.

NASDAQ
Point 1, 3 and 5 are at the top of the spreading channel, Point 2 and 4 at the bottom of the pattern. A failure to break up through the current point 5 level could induce hard selling.
Utilizing candlestick signals and price patterns creates a huge advantage. Expected results occur after specific price patterns. A failure to break out of the top trend channel has expected result based upon historical analysis. The next wave could be a very strong downside move. A breakthrough of the upper trend channel makes for a different analysis. The short term pattern would be giving a different evaluation. A price move through the recent high would confirm a Jay hook pattern, indicating more upside potential. This would also negate the development of the Spreading pattern.
The result of this if/then situation is much easier to evaluate when witnessing which candlestick signals are forming at the upper trend resistance level. Knowing what could result from a breakthrough or a failure of that level allows the candlestick investor to be prepared for establishing the direction of the portfolio. This pattern analysis works effectively in stocks, commodities, currencies, or any trading entity that involves human input.
Take advantage of the information that can be provided by the combination of candlestick signals and patterns. It allows you to maintain control of your investment analysis. High probability expected-results occur after recognized patterns setups. It is not difficult to visually learn when to reverse a portfolio or add to the direction of a portfolio.
Chat session tonight for members at 8 p.m. ET. Check the Member Area for instructions.
Good investing,
The Candlestick Forum Team
FREE DOMESTIC SHIPPING on all Holiday Specials
Website special reflects current newsletter. If you are reading an archived newsletter you will be directed to Current Website Special
Speak Your Mind