laying the stock market becomes a much easier process when knowing which direction the markets are moving. The information incorporated in the Candlestick signals makes analyzing the market direction very easy. When playing the stock market, profits expand dramatically when being positioned correctly in the trends.
Understanding what the Candlestick signals demonstrate when in the overbought or oversold conditions allows the Candlestick investor to greatly reduce market exposure risk. Most investors playing the stock market want to be long all the time. The advantage of the Candlestick signals allows an investor to analyze whether to be long, short, or have positions in both directions. Having the ability to analyze the signals correctly makes analyzing the market direction very easy.
The past few weeks, it has been recommended to be positioned towards the ‘long’ side, although not aggressively. The analysis of the market indicated that a pullback was in progress but not a very convincing pullback. Under these conditions, specific sectors/stocks produce some very good profits on the long side. Had the Candlestick signals illustrated more severe selling possibilities, a different strategy would have been put in place. This summer, usually the slow time of year for trading, has produced some significant gains while playing the stock market.
Market Direction
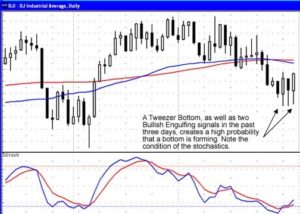
As can be seen in the Dow chart, the decline over the past month and a half has been very slow and calculated. Numerous indecisive trading days revealed that there was no great urgency to take money out of the markets. With that analysis, putting investment funds into the strong sectors was not going to be influenced greatly by severe negative market sentiment. A large number of stocks were showing buy signals once they came back and tested the 50 day moving averages. This provided on another indication of the presence of buyers in the market.
Over the past few days, the Dow has shown some good bottoming signals as the stochastics were turning up out of the oversold condition. Monday formed a Bullish Engulfing signal. Although Tuesday sold off again, it produced a significant bottoming signal. Note how the lows of both Monday and Tuesday were exactly the same. This created a Tweezer Bottom. A Tweezer Bottom has significance in that it illustrates a level where the buyers step in more than once. Wednesday’s trading also produced a tail to the downside that almost tested the same a low level. The strong close on Wednesday formed a second Bullish Engulfing signal in the last three days. This would be a strong indication that the buyers have bottomed out the markets.

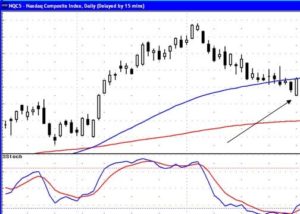
The NASDAQ formed a Bullish Engulfing signal right at the 50 day moving average. The next day it formed a Doji/Hammer signal followed by a bullish candle that breached the 50 day moving average. The stochastics have now turned back up. All this occurred when the news reports were telling how terrible the oil shortage may be. Continue to buy on strength.

Option Trades – The Candlestick signal analysis makes for some very successful option trades. Being able to analyze what the signals are doing, in respect to creating a high profit pattern, allows for the implementation of high profit option trading strategies.
Speak Your Mind