When you sell currency in the forex market there is actually no physical exchange of currencies. The trades that are placed are only computer entries and the profits and losses are recorded on the trader’s account after they are calculated. The FX market is purely speculative in nature and the only reason that it exists today is to assist in the exchange of one currency to another for those company’s that constantly trade currencies. These companies trade currencies for many reasons some of which include for the costs of services and goods from foreign vendors as well as for payroll needs.
As you learn to trade currency as a FX trader keep in mind that only about 20% of the market volume for forex is due to company needs and about 80% of the actual trades that take place on the currency exchange are speculative. The 80% of the market volume actually consists of hedge funds, and large financial institutions, as well as individual forex traders.
As you learn about forex trading you will find that currency is always traded in pairs. There are many currency pairs and then there are the major currency pairs that are mostly traded on the forex market. As you sell currency you learn that when a forex trader makes a trade he or she is long one currency and is short the other currency. For example, when looking at the currency pair USD/EUR you will learn that you are short the dollar and long the Euro.
There are forex trading strategies that you will learn about as well as you learn to sell currency. These techniques can include shorting, going long or trading options. Shorting currencies is similar to shorting stocks in that the same concepts apply. If you short a stock or currency then you think that the value of the security will go down (compared to another currency). Going long follows the same concept with stocks as it does with currencies as well. When you go long it means that the trader things that the currency will increase in value (compared to another currency).
There are two options strategies called a strangle and a straddle. They also apply to stocks as well as to currencies. The strangle occurs when the investor buys an out-of-the-money call and an out-of-the-money put option. This trading strategy is only profitable is if there are major movements in the price of the currency. The straddle occurs when the investor believes that the currency’s price will make a significant move but he or she is unsure of the direction it will take. This is a very risky strategy because if the currency moves either way, but with a small movement instead of a major movement, then the investor will lose out on the trade.
Market Direction
Eat like a bird and poop like an elephant! That is the description of most investors mental attitude. It represents what most investors have a tendency to do. When they buy a stock, and it goes up, they are very quick to take profits.
How foolish they would look if they had profits that they allowed to turn back into a loss. To escape that embarrassment, they take their profits very quickly, usually leaving some good potential gains on the table. On the other hand, if a stock price immediately goes down, the ego does not allow investors to say I made a mistake, get out of the position immediately. They will hold a position with the hope that it will turn around and go positive. After a while, they hope the price will get them back to break even, where they will intend to come out of the position. As the price continues to go lower, the hope gets bigger. They are just waiting for the price the turn around. Finally, when they cannot stand the pain any longer, they sell out. This is usually near the bottom.
How do you keep yourself from cutting your profits short and letting your losses run? Candlestick analysis provides a very easy solution. When you buy a position, it was done on the basis that a candlestick signal was showing the Bulls were taking control. If/when the price comes back down and negates the bullish signal, close out the position immediately.
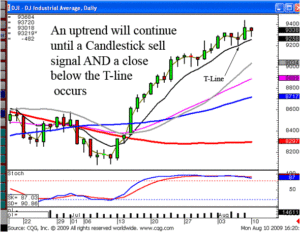
When prices go up, most investors feel the anxiety that they need to take profits. The further prices continue to move, the more the fear of losing gains become. Candlestick analysis provides some very simple parameters for relieving that anxiety. When do you buy? When you see a candlestick buy signal! When do sell? When you see a candlestick sell signal. However, that ‘sell’ signal needs to be more compelling as a trend continues. The same facets to show a candlestick reversal signal are also built into a price trend. The longer a price trend continues, the more ‘set’ investor sentiment becomes. The trend will continue until a dramatic change of investor sentiment occurs. This usually requires a candlestick sell signal AND a close below the T-line.

DOW
The T-line creates some very simple strategic parameters. The candlestick signals illustrate a possible change in investor sentiment. A close below the T-line illustrates high probability confirmation a change in investor sentiment has occurred. If you know what each candlestick signal represents, you gain an immense amount of clarity about a trend move when it is applied to other successful indicators. Understanding the relationship of candlestick signals and the T-line will provide a dramatic improvement in portfolio profits. It provides a twofold affect. Profits are improved by executing trades at more appropriate price levels and an investors minds remains much more clear for making investment decisions. This clarity dramatically improves an investors analytical confidence.
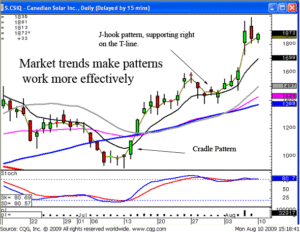
Having the ability to decipher between a profit-taking pullback and a full-scale reversal allows an investor to take advantage of price patterns. This becomes important when trying to identify the optimal spots to have investment funds. All boats will rise in a rising tide. The advantage candlestick analysis provides is the predetermined results of candlestick patterns. Whereas a normal price move in a bullish market might produce a 10% gain, the results of a Fry pan bottom, scoop pattern, or cradle pattern may produce a 30%, 50%, or hundred percent gain in the same market conditions.
CSIQ illustrates high profit pattern potential. The initial cradle pattern is followed by a Jay hook pattern. A Jay hook pattern confirms at an obvious breakout area. Having the knowledge of where to sell and where to buy back provides a powerful trading platform. Not taking advantage of the information produced in a candlestick chart is like investing with one leg of the stool missing.

CSIQ
There is nothing difficult about candlestick analysis. Once you learn the common sense built into the signals and patterns, you gain a very valuable investment tool that you will be able to apply for the rest of your investment career. Whether you are trading stocks, options, bonds, currency, or commodities, prices move based upon investor decision-making. If you acknowledge the fact the Japanese Rice traders merely mapped out what investor sentiment was doing, your investment returns will improve dramatically.
Chat session tonight at 8 p.m. ET for members.
Good investing,
The Candlestick Forum Team

Speak Your Mind