Everybody at one time or another feels like they need ‘Stock Investing for Dummies.’ Some investors go for years and years listening to advice from the next professional adviser that they hope will do better than the previous one. This is usually the process of stock investing for dummies, a constant search for somebody that can help an investor make money in their account.
If an investor wants to get out of the cycle of feeling that they need the ‘Golden Goose’ course that teaches stock investing for dummies, the process is very simple. Learn a trading method that works. Does it have to constantly work? No, but the idea is to find a trading method that puts the probabilities in the investor’s favor. Without remaining with a consistent trading program, when things aren’t working, a trading program should be able to be analyzed. When something’s broken, it can be fixed. Moving to another trading program when things aren’t working never allows an investor to understand what was wrong and what needed to be fixed. Candlestick charts analysis is the common-sense utilization of proven investment techniques. Learn how to invest properly using high-probability signals and your investment acumen will be improved for the remainder of your investment career.
Gap-up Stock Trading – The emphasis has been put on gap-up stock trading for the past few weeks during the Monday night and Thursday night chat sessions. The reason for educating investors on gap-up stock trading is simple. Gap-up stock trading, after the appearance of a bullish Candlestick signal, produces extremely high probability, high profit trades. Utilizing Candlestick analysis to interpret a gap-up is relatively simple. Investors want to get into a position with great enthusiasm.
Witnessing a Candlestick buy signal in oversold conditions illustrates a change of investor sentiment. Witnessing a gap-up in price, after the bullish signal, illustrates that not only has the investor sentiment changed, it has changed with great strength. Finding a trade that has shown a reversal and a new trend starting with great fervor is exactly what investor should be looking for.
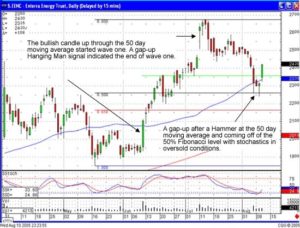
Applying all of the indicators that reveal a high probability reversal is the first step for a finding a high profit trade. Those indicators, followed by a gap-up, demonstrate an additional reason for committing investment funds. EENC is an example of a chart that has all of the indicators in alignment.

A quick evaluation can be made visually. The most important indicator is the formation of a potential Candlestick buy signal, a Hammer signal. A Hammer signal is formed with the stochastics in the oversold area, starting to curl up. That becomes the criteria for analyzing whether this chart pattern has a high profit scenario.
The 50 day moving average becomes an important factor. Visually, it can be analyzed that the bullish candle breakout of early June was the beginning of an uptrend. It breached the 50 day moving average. The uptrend continued with relatively good strength until the appearance of a gap-up at the top. A Hanging Man formation appeared, indicating that the top was close at hand. The pullback came right back to the 50 day moving average as the stochastics came into the oversold condition.
The pullback coincides with the 50% retracement of the Fibonacci numbers. A wave one move appeared from early June until early July. A potential wave two pulled back to the 50 day moving average. A strong buy signal has now occurred, possibly starting wave three. Wave three usually has the same magnitude move as wave one. $29 to $30 now becomes the next potential target.
Once the eye becomes trained to identify high profit trades, the analysis of this chart becomes almost instantaneous. The signal created during the last couple of days warrants investigating the chart pattern further. The remaining criteria can be evaluated in less than a minute. Learning the parameters that create high profit trade situations becomes relatively easy. Having the capability of identifying high profit signals eliminates the need for ?stock trading for dummies.?
Speak Your Mind