Stock Market Made Easy with Candlestick Signals
The stock market can be made easy to learn when utilizing candlestick signals. The signals are merely investor sentiment put into a graphic depiction. The stock market can be made easy to learn when incorporating the information produced by candlestick signals. Not only can the stock market be made easy to evaluate, but also the candlestick signals can be utilized in all trading areas, commodities, currencies, bond prices. Applying the information conveyed in candlestick signals to other simple technical indicators creates a trading environment that puts the probabilities highly in the investors favor.
Profiting in the stock market is made easy when an investor realizes that prices move in patterns. Prices are influenced mostly by investor sentiment. Investor sentiment can always be graphically analyzed. The candlestick signals reveal changes of investor sentiment. Additionally, using candlestick signals helps identify where the extraordinary strength is coming into a trend or out of a trend. Being able to recognize a pattern set up allows the candlestick investor to participate in the high probability/high profit trades.
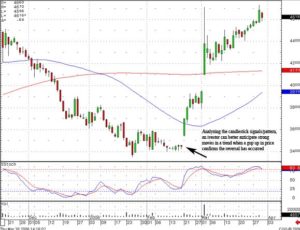
Witnessing a candlestick signal in an oversold condition followed by a gap up is a very reliable profit situation. Simply analyzed, the candlestick signal usually represents a change of investor sentiment. When this occurs in the oversold conditions, the probabilities are extremely high that a profitable trade will occur. A candlestick reversal signal in those conditions, followed by a gap up in price, clearly demonstrates that after the indecision the buyers started coming back into the price with enthusiasm. This is exactly the price trend that an investor wants to be in. A price coming out of the oversold condition with investors very enthusiastic about getting into that stock.
This can be clearly illustrated in the Longs Drug Stores Inc. chart, recommended by the candlestick forum the day after the gap up. Utilizing candlestick charts dramatically improves the ability to anticipate a potentially strong move. The gap up bullish candle occurred after a hammer/Harami. The stochastics revealed the price coming out of an oversold condition. The gap up through the 50 day moving average indicated that the 50 day moving average was not going to act as resistance. Being able to witness the series of doji’s that occurred during the prior two weeks before the gap up becomes significant information. There was a lot of indecision occurring. The gap up from that level immediately revealed that the decision of the new direction had been made. Also, a gap up illustrated that the decision was being made with considerable force. This type of analysis allows stock market analysis to be made easy.

LDG
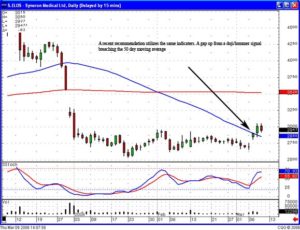
These patterns occur constantly. A recent recommendation was ELOS. The same scenario. A flat trading area show an indecisive trading with a doji followed by a gap up in price. The stochastics started to curl up out of the oversold condition. Where will he go from here? That now leads to what everybody else may be watching. Once it breached the 50 day moving average, the next target could become the 200 day moving average . Moving to that level would also fill the gap formed in late December.

ELOS
Using candlestick signals makes profiting in the stock market made easy. Investor sentiment will stay the same throughout history. The panic and enthusiasm of investors will constantly create recognizable trading patterns. These patterns have produced a high statistical probability results for centuries. And they will do so for many centuries to come. The advantage investors have today is having computer software programs that make identifying these patterns very easy. When applying candlestick signals to those patterns, the analysis becomes much easier yet.
The Candlestick Forum is making available a package of investor patterns training CDs. This eight CD package clearly demonstrates patterns that occur regularly in the markets. When candlestick signals are added to the analysis of these patterns, it creates a very profitable investment format. What should these patterns produce? Expected results! What becomes a primary factor for illustrating whether the expected results are occurring? The candlestick signals! When prices get to certain point of a pattern, the expectations of whether that pattern is working properly will be demonstrated by the candlestick formations.
Speak Your Mind