Candlestick signals become important for swing trading. Understanding what the signals are telling you will produces a very accurate format for swing trading as well as all other forms of investing. Swing trading, with a short-term outlook, requires being able to see exactly what the trends are doing over a 3 to 10 day period. The use of Candlestick’s become much more important especially in a market trend that is not showing very much conviction one way or the other. Understanding what the Candlestick signals are telling you becomes an important factor for making profits and for limiting losses. Interpreting what the signals are telling you is very easy. Whether swing trading, day-trading, or long term investing, the probabilities of being on the correct side of the trade grows dramatically when utilizing the information conveyed in a Candlestick signal.
Market Direction
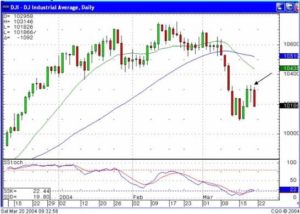
As was noted late last week and early this week, two Harami signals indicated that the downtrend had stopped. At that time, with the trend apparently bottoming midway between the 50 day moving average in the 200 day moving average, a quick analysis would have suggested an up move to test either the 20 day moving average or the 50 day moving average. However, Thursday produced a doji, demonstrating indecision, and Friday created a bearish candle in the Dow, that closed more than halfway down the bullish candle the day prior to the doji. The last three days formed an Evening Star signal. A true Evening Star signal would be witnessed when the stochastics are in the overbought area.

Dow
Even though the Evening Star signal did not occur in overbought area, the formation still has to be evaluated as to what is the investor sentiment appearing to be at this time. Very simply stated, after Thursday’s doji, there was an opportunity for the Bulls to continue the rally. But we saw that the selling had stepped back in. Had we seen a bullish day on Friday, the evaluation of the market trend would have been simple, they are still moving this market up. After the big sell-off on Friday, and the stochastics coming out of the oversold area but turning back down, now allows us to analyze what Monday’s market action could produce.
Before the appearance of the two haramis last week, the Dow’s pullback had been fairly severe. The projection had been that it may test the 200 day moving average down near the 9800 level. The market action, as seen this past week reveals a mild bounce in a down-trending market. Friday’s action, after the doji, and forming a an evening Star signal, should now tell us that if we see weakness on Monday, the last weeks bounce may be over and we are now still heading for the 200 day moving average.
Is this a complete change of projections for just a few days ago? Yes, but that is what using the candlestick signals tell you to do. What could have been the possibilities from the market indications a few days ago has been completely altered by what the candlestick signals are telling us now. That is the whole premise of using candlestick analysis. It changes the investment strategy from being positioned in the direction of what you ” think” the market is going to do to a market strategy based upon what the candlestick signals are indicating the investor sentiment is now.
What may have been the correct analysis five days ago may not be the same analysis today. Most investors lose money because once they make an analysis of the market direction, their ego holds them to that analysis versus being willing to alter their analysis when things change, whether it be three days, three weeks, or three months. What looked like could be a test of the 50 day moving average in the Dow just a few days ago, now has the probabilities reverting back to testing the 200 day moving average if further weakness as seen in the market on Monday.
Speak Your Mind