Swing trading stocks has become more prevalent over the past few years. The instant trading capabilities provided by online trading services has made swing trading stocks a highly profitable trading program. Candlestick signals increase the profitability for swing trading stocks. The recent volatility, or lack of volatility, in the markets has made swing trading stock programs a much more viable profit producer for short term investors.
Candlestick signals are the measure of investor sentiment during a certain time frame. This time frame could be a one-minute chart pattern or a monthly chart pattern. Whereas the day trader may use one-minute, five-minute, and fifteen- minute chart combinations, the investor that is swing trading stocks may be more inclined to use daily charts only. Normally swing trades last anywhere from two to ten trading days. The long-term investor, on the other hand, would use a daily, weekly, and monthly chart combination to best evaluate their positions. Utilizing candlestick charts makes this evaluation much easier
Using a daily chart for swing trading stocks can utilize Candlestick signals very profitably. When markets do not appear to have any directional force for more than a few days at any time, swing trading stocks becomes the most viable program. The normal reversal action usually involves a three day pattern. Building this into a choppy market scenario produces some high-profit trades.
Market Direction
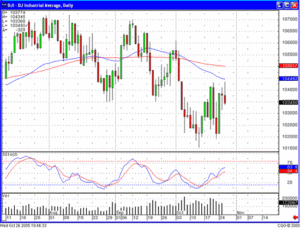
Last week the Dow went through a very choppy period. Monday’s big day to the upside indicated a Double Bottom. It formed a Bullish Engulfing signal while stochastics were still moving in an upward direction. This strong up-move provided valuable information coming out of the congestion area. This made the next logical target the 50 day and 200 day moving averages. The pullback on Wednesday was not an unexpected event after the 170 point move in the Dow.

Dow
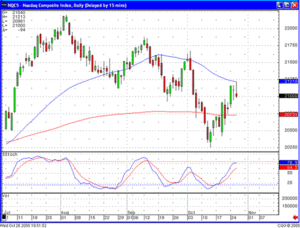
The NASDAQ just touched the 50 day moving average on Wednesday. With the Dow needing a couple of more days to get out into the moving average area, and the NASDAQ forming a Shooting Star signal indicates that the uptrend may be running out of steam. It is doing so at obvious descending trend lines that have formed through the recent tops. Another failure at those trend lines would indicate that it was time to take some profits and start watching for the down-trending markets to start again.

NASDAQ
Breakouts
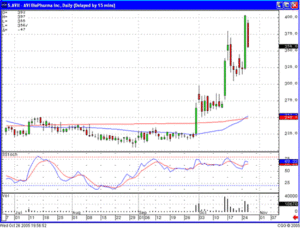
Breakouts are the most powerful patterns. The initial breakout candle usually becomes an alert to investigate what has changed investor sentiment regarding that stock. A large candle, coming out of a stagnant trading range, is usually instigated by news or an event that is going to greatly affect the future of that company. The AVII chart illustrates a big candle formation accompanied with large volume. There was good news for the company that day. An important factor for profiting from a breakout situation is to be able to identify what investors are doing after a big percentage move. Severe selling conveys a much different message than profit-taking candles.
As seen in the AVII chart, the sellers did not have enough force to drive the price back down after the initial breakout. That has led to another big percentage move in the price of the stock over the next few weeks. A high probability scenario, after the initial breakout, will be that the price trend will continue up for a good amount of time. Whatever news that caused the breakout will continually be analyzed through the different investment medias.

AVII
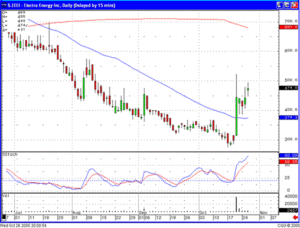
The same scenario is illustrated in the Electro Energy Inc. chart. News about a contract on their lithium batteries has now brought attention to the stock. The initial profit-taking after an approximately 45% positive day appears to be over. The anticipation of further upside movement is based on the prospects that more people will invest in the company as the news about their contract is disseminated to the print media. The advantage that Candlestick signals provide is being able to identify what investors are doing after the initial breakout move. The next two days were Hammer-type signals, indicating some profit-taking but no severe selling. Once that selling was soaked up, the buying continued.

Electro Energy
The Book is Finished!
‘High Profit Candlestick Patterns’ is at the printers. The expected delivery date is near the end of November or the beginning of December. This book will contain over 400 pages of Candlestick insights. It will go into much more detail on the major signals, entry and exit strategies, and stop loss procedures. Bill Johnson, who has written a number of books on option trading strategies, has added a chapter on how to improve your Candlestick option trading programs. Tina Logan, a well-known technical trading strategist has contributed a chapter on her insights for utilizing Candlestick signals in short term technical trading.
Revealed in:
High Profit Candlestick Patterns:
Turning Investor Sentiment into Profits
by Stephen W. Bigalow
The immense amount of information incorporated into Candlestick signals is abundantly illustrated with simple visual techniques. The often misunderstood Japanese Candlestick charting techniques are clearly demonstrated. Steve Bigalow’s ‘Profitable Candlestick Trading’ book resulted in an overwhelming response from investors finally learning how to utilize Candlestick signals profitably. His new book ‘High Profit Candlestick Patterns’ introduces the investor to a refreshingly new and high-powered investment perspective. Candlestick signals provide visually compelling results. Japanese Candlestick charting techniques, integrated with statistically proven Western technical analysis, produce an even more powerful investment platform. The ability to recognize trading patterns in their very early stages empowers an investor with high profit trading strategies.
For the technical investor, the combined analysis provides potent trading programs. The fundamental investor gains tremendous insights into the timing of positions. The introduction of cutting-edge computer generated technical analysis, with the world’s most proven trading technique, becomes a powerful tool for understanding the movements of the markets. Discover simple techniques that put the probabilities highly in your favor.
The book is scheduled to be published in the first week of December 2005. First edition, signed copies will be provided in pre-publication specials starting on November 1, 2005. Start watching for the promotions on the web site.
Be Prepared!
November should be a very busy month at the Candlestick Forum. The new site should be up and running. It will be much easier to maneuver to the services available for the members. A book special will be made available. Scheduling for another private training session will take place. And finally, funds will start to be accepted for the Candlestick Partner Hedge Fund. Watch for the announcements.
Private Training Sessions
The analysis of what one market can do to another is easily evaluated when using Candlestick signals. The process for projecting market direction becomes relatively easy when a Candlestick investor can utilize the signals to evaluate all the markets that might be affecting the stock market. The better one can analyze the market direction, the much greater the profit potential.
Steve Bigalow spends a good amount of time during his two-day private training sessions demonstrating how to use the Candlestick signals to accurately evaluate market trends. Adding this information to the identification of high profit signal patterns allows an investor to control the profitability of their portfolio for the rest of their investment career.
Don’t miss the opportunity to gain some valuable knowledge first hand. The Candlestick signals produce an immense amount of analytical information. Whether trading stocks, commodities, Forex, or tulip bulbs, Candlestick analysis will dramatically improve your profitability. This information is taught in a very easy-to-understand manner.
If you’re interested in spending two full days with Steve Bigalow, learning all the intricacies for trading Candlestick signals profitably, do not miss this opportunity. The information that you are receive from a two-day training session with six months of follow-up will pay for itself many thousands of times over. You’ll get a full grasp of what makes prices move at reversal points. You’ll have a full understanding of the investor sentiment that make prices move. This knowledge will greatly enhance your profitability for the rest of your life.
We are in the process of scheduling more private training sessions for the coming months. We will provide the details in future newsletters.
If you would like more information on the training sessions, please contact us immediately. We will provide you with all the information you require for attending the next class. To contact us by phone, please dial our toll free number: 1-866-251-4015. Contact us now, spaces will fill up fast.
Monday Night ‘Members Only’ Chat Session
We will not have a chat session on Monday, October 31st due to Halloween. The next chat session for Members will be on Monday night, November 7th, at 8:00 p.m. Eastern time. Members, have a happy and safe Halloween weekend and we’ll see you on November 7th.
Thursday Night Open Chat Session
Everyone is invited to attend our Thursday night chat sessions. Please tell all of your friends! The next Open Stock Chat will be scheduled for Thursday night, October 27th, at 8:00 p.m. Eastern time.
The Major Signals Educational Package – NOW ON DVD!
The response to the 12 major signals CD training program has been astounding. There has been strong feedback that the in-depth analysis of each major signal is done in a clear and concise manner. The learning process becomes very easy when all the elements of what makes for a strong successful reversal signal to work correctly is explained by Stephen W. Bigalow. Each 45-minute training session not only explains what indicators confirm the effectiveness of each of the major signals, but it goes into the investor psychology that was present that made each signal occur. Understanding the psychology of investors when a reversal is occurring is a tremendous insight into what makes prices move.
A New Twist to an Old Favorite!
DVDs of the 12 Major Candlestick Signals – For those of you that would like to thoroughly analyze the 12 major signals, the signals that will perform more reversal patterns prospects than most investors will be able to utilize, the eight hours of concise analysis for each signal is now on DVD’s. For the investor who likes to get comfortable in front of their TV screen, this DVD set will provide the opportunity to relax and learn at the same time.
Over $509 of valuable Candlestick signal education, for identifying the most powerful Candlestick reversal signals, is now priced at: $397.77
Do not delay, gain the understanding of how prices move. This is information that you will be able to use for the rest of your life. The profits that this information provides can be made in your account month after month after month.
You should never be put in a position where you do not understand why trades are being made for your account. Whether those positions are being put on in your managed account, or a hedge fund, or your own personal trading, you should have a full understanding of whether those funds are being put in the right positions at the right time. The Candlestick signals applied with Candlestick analysis will become the education process for understanding how to maximize your potential returns in your own trading or being able to analyze whether a money manager has any concept of correctly timing the markets.
Speak Your Mind