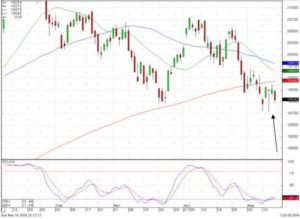
Market Direction – For the as two weeks, the NASDAQ has produced many indecision type days. Doji’s, and inverted hammers, hammers, all occurring when the stochastics have been in the oversold conditions. This would usually indicate that a major trend reversal is about to occur. However, this period of indecision has been in a slow downwards direction. The stochastics for the NASDAQ was just coming up out of the oversold area but now looks like they could be moving it backed down. The Dow has been showing some indecision days right on the 200 day moving average with the stochastics coming up all the oversold area. Friday formed another doji day.
The Doji in the Dow on Friday at lease provides a trading platform for Monday morning. A general rule of thumb is that the trend will move in the direction of how it opens on the day after a doji. The indications favor that some buying should be moving the trend upwards. However, these indications have been present for the last four to five days. If nothing positive happens on Monday or Tuesday, that would be an indication that the buyers are still not in this market and this may just be a consolidation before the next move down.
As you may have seen in the morning comments, it has been advised to be heavier in cash recently. The reason for this is that the signals are indicating that we are in a bottoming condition in the markets but there has not been any buying confirmation as of yet. It has been advised to buy lightly in this area but to be very nimble, be ready to close out positions as they get weak. This is contrary to the usual Candlestick investing philosophy. With 9900 trading entities out on the market, the candlestick signals can find enough good buy signals and sell signals to always have the portfolio completely invested. However, as we have witnessed in the NASDAQ, especially the last two weeks, each day is illustrating very indecisive investment sentiment. Up one day with the doji, down the next day with a doji, up one day with a hammer, down the next day with an inverted hammer. The candlestick signals are a very powerful investment platform for putting the probabilities of being in a correct trade in your favor. There are times in the market when those probabilities cannot be easily identified. The point of investing is to make money by exploiting the advantages of whatever trading program you’re using. When the market gets in a condition that those advantages cannot be put to good use, why have your money exposed? It is better to sit back in cash until the advantages can be utilized. This produces some mental rest and gets the mind clear for identifying the next move in the markets.

Example of Hammers in the Market
The one major signal that was produced this past week was the huge hammer that formed in both the NASDAQ and the Dow on Wednesday. The hammer represents selling at the bottom and finally the buyers stepping in. The long shadow to the down side is the obvious feature. It usually represents the very bottom of the downtrend. Unfortunately, the trading can continue to languish in the area of the shadow for a while. This could mean another few weeks of a sloppy sideways market if a signal does not appear showing which way the market will go. This all may seem very nebulous as far as projecting what the market should do, but there are times when the signals tell us that the market doesn’t know what it wants to do. This may be one of those times.

HAMMERS
(karakasa)
Description
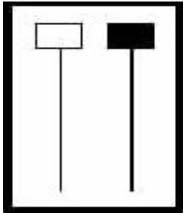
The Hammer is comprised of one candle. It is easily identified by the presence of a small body with a shadow at least two times greater than the body. Found at the bottom of a downtrend, this shows evidence that the bulls started to step in. The color of the small body is not important but a white candle has slightly more bullish implications than the black body. A positive day is required the following day to confirm this signal.
Criteria
- The lower shadow should be at least two times the length of the body.
- The real body is at the upper end of the trading range. The color of the body is not important although a white body should have slightly more bullish implications.
- There should be no upper shadow or a very small upper shadow.
- The following day needs to confirm the Hammer signal with a strong bullish
day.
Signal Enhancements
- The longer the lower shadow, the higher the potential of a reversal occurring.
- A gap down from the previous day’s close sets up for a stronger reversal move provided the day after the Hammer signal opens higher.
- Large volume on the Hammer day increases the chances that a blow off day has occurred.
Pattern Psychology
After a downtrend has been in effect, the atmosphere is very bearish. The price opens and starts to trade lower. The bears are still in control. The bulls then step in. They start bringing the price back up towards the top of the trading range. This creates a small body with a large lower shadow. This represents that the bears could not maintain control. The long lower shadow now has the bears questioning whether the decline is still intact. A higher open the next day would confirm that the bulls had taken control.
Speak Your Mind