A trading breakout is an upward movement of the price in trading stocks, trading options, trading commodities, or trading futures that occurs after a period of the equity in question trading within a range. Traders can profit by trading the support and resistance zones of the trading range and they profit from anticipating and effectively trading the trading breakout. Traders use two methods to anticipate a trading breakout. One is the tool of long term investing. It is fundamental analysis.
The trader may come to believe, after taking a close look at a stock’s fundamentals, that its intrinsic stock value is greater than the stock price range it is trading in. Thus he will anticipate an upward trading breakout based strictly upon fundamentals. The more effective way to anticipate and profit from a trading breakout is to combine both fundamental and technical analysis of the stock in question. Using Candlestick pattern formations as a guide, a trader can commonly let the market tell him what it will do. Using price patterns the trader can successfully anticipate when a trading breakout will occur. Although the fundamentals may indicate an eventual upward movement in stock price it is technical analysis with Candlestick charts that tells the trader when to make the move.
Stocks and other equities trade in ranges based upon the market’s consensus of price. The upper and lower limits of the trading range are often set by the market’s reading of the stock’s fundamentals. Traders will buy in the belief that the stock will go up in price and sell in the belief that it will go down in price. Lots of traders buying a stock drive the stock price up and lots of traders selling a stock drive the stock price down. Using Candlestick analysis the wise trader will typically be able to anticipate price turnarounds at both the high and low ends of the stockfs trading range.
A stock that is trading between its support and resistance prices is not a stock on an upward or downward trend. It is often a stock about which the market has not made up its collective mind. When the market starts to come to a consensus on a stock, the stockfs trading range may start to narrow. This is one of the signals that a stock may be ready for a trading breakout. By the use of Candlestick stock charts a trader can commonly see the trading breakout coming as predicted by Candlestick patterns that evolve as the stock price progresses.
After a trading breakout a stock may well follow current market trends, in a bull market, for example. Looking at the broader market will help the trader anticipate market reversal, continuance of the trend, or even a market rally. Following the stock with Candlestick signals will help the trader decide when to sell stock or when to sell short in anticipate of a substantial decline in stock price. Depending on the intrinsic stock value and margin of safety of a stock the profits from a trading breakout may well be long term and not temporary. Letting Candlestick signals be a guide the wise trader can often multiply profits from an upward movement in a stock’s price.
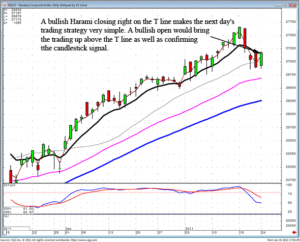
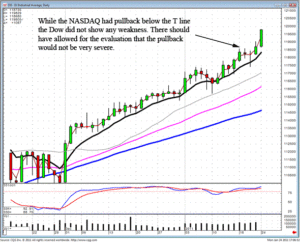
This past week the market produced some confusing information. The Dow continued its uptrend. It had formed a couple of Doji’s but they were not confirmed. The NASDAQ showed hard selling but it did not create a true candlestick sell signal. As the Dow was continuing upward, the NASDAQ was moving down. Although this is not normally an uncommon occurrence, the magnitude in which each index was moving revealed buying and selling that did not correlate with each other. Today’s strengths continued the DOW trend while forming a bullish Harami in the NASDAQ. This continues to reveal the importance for knowing which signals and price movements are real candlestick signals.

DOW
As illustrated in the NASDAQ, the lack of a reversal signal should have given more evidence to a temporary pullback versus a full-fledged reversal. The reversal of a trend is still likely to be dictated by a recognized candlestick sell signal. Today’s positive trading was confirmation that a lack of a sell signal meant the Bulls were still in control.

NASDAQ
There will often be times in the market when it is difficult to analyze which direction the trend is going. Fortunately, with candlestick analysis, indicators for whether to be long or short will fall back into place. The Dow and the S&P 500 both closed above the T-line. The Dow had not even made the T-line a contention. The S&P 500 showed indecisive trading at the T-line and then traded back above it. The NYSE, a much broader index than the Dow 30, also showed a chart pattern that supported at the T-line. The NASDAQ is the only major index that was trading below the T-line. It formed a bullish Harami today. This makes the trend analysis come back together. A positive open tomorrow in the NASDAQ would confirm the Bulls were still in control in all indexes.
The commonsense aspects of investing are built into candlestick analysis. Whether a day trader, swing trader, or long-term investor, being able to analyze the overall trend of the market is an extremely important aspect for establishing positions. Most investors never find the proper trading platform. They are expecting the green arrow and the red arrow to indicate when it is time to buy and when it is time to sell. The candlestick investor gains a huge advantage by understanding what the overall market trend is doing and then analyzing with stocks will perform the best. This also allows for flexibility in market conditions that other investors may have a difficult time maneuvering. Currently, there are stocks that are performing well to the long side as well as stocks performing well to the short side. When market conditions become fuzzy, the candlestick investor still has the capability of analyzing individual stock patterns that will work well whether the market is going up or going down. Essentially this is the investment knowledge that will allow you to control your returns no matter which direction the market is going.
Chat session tonight at 8 PM ET
Good Investing,
The Candlestick Forum Team
Website special reflects current newsletter. If you are reading an archived newsletter you will be directed to Current Website Special
Speak Your Mind