What is the main purpose of technical analysis? It is the visual evaluation of chart patterns that reveal high profit situations. Candlestick signals provide the ultimate technical analysis tools for identifying price reversals.
Understanding how to use the Candlestick signals effectively allows an investor to master the markets. Technical analysis tools should be easy to use and have a high-probability expected result.
Using Candlestick signals with other technical analysis tools dramatically enhances trend analysis capabilities. Where other technical analysis tools provide a format for anticipating what ‘might’ be a price reversal area, the Candlestick signals provide the information that demonstrates exactly what is going on at those levels. The results of hundreds of years of actual use make Candlestick signals one of the most effective technical analysis tools.
The news media can be your first source of where to apply technical analysis tools. The Candlestick signals identify the result of investor sentiment. As has been seen for the past two months, Crude Oil prices were the main concern. Of course, high gasoline prices were going to be a big damper on the American economy. The media was reminding us of that fact over and over. Now there is a new fear! Natural Gas prices! Heating our homes through a cold winter is going to deplete the American family’s budget.
The media has now targeted the next fear factor. However, having the ability to analyze the price trends of other factors that may cause positive or negative sentiment in the equities market becomes a valuable technical analysis tool. The Candlestick signals can be utilized for analyzing any trading entity that involves fear and greed.
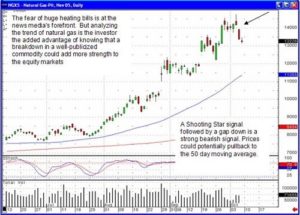
Natural Gas
Market Direction
The immense advantage that Candlestick signals provide is the capability to visually witness what a trend might be doing at important technical levels.
The evaluation of what the Dow might be doing becomes much easier to visualize when applying Candlestick signals to other technical analysis tools. As seen, the Bullish Harami stopped the downtrend right at the previous lows of late August. Stochastics were in the oversold area starting to curl back up. What would have been the logical target? The 10,700 level that seems to be the resistance area, creating a trend channel.
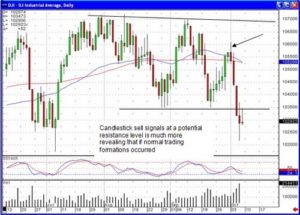
The Dow
However, the moving averages were the first target. Prior to reaching the level of the moving averages, they may have been evaluated as being a possible congestion area. Viewing the moving averages back through mid-August, they revealed some congestion at those levels but the trend eventually moved through them. The Candlestick signals allow the investor to actually see what is occurring when the moving averages are tested. In the case of the Dow, a small Hanging Man signal was followed by a Bearish Engulfing signal. These were reversal signals. This is stated to point out that there could have been some selling or congestion on the moving averages where the formations were not actual signals. The fact that Candlestick “sell” signals formed at these levels provides a completely different analysis. The expectation of a reversal at the moving averages becomes that much more anticipated than if non-signal selling days had occurred at the moving averages.
The same could be seen in the NASDAQ chart. As the NASDAQ came back up to the 50 day moving average, it formed a Shooting Star. Not only was this a potential sell signal, but the fact that it gapped up slightly and then formed a Candlestick ‘sell’ signal was that much more of a forewarning that the 50 day moving average was going to act as resistance. This becomes further confirmed the
Speak Your Mind