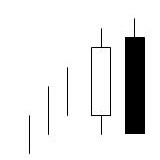
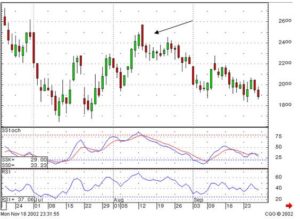
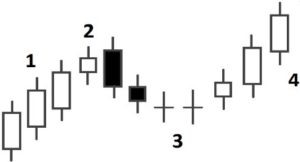
The major Candlestick reversal signals are very illuminating. They are hundreds of years of visual observations revealing high probabilities of a reversal occurring. Not to overstate the obvious, but if Candlestick signals didn’t work, we would not be looking at them today. The Japanese rice traders that they used candlestick signals became enormously wealthy.
The major benefit of Candlestick signals is that they are very easy to learn and identify. You do not need to learn formulas. You do not have to do extensive fundamental analysis. A Japanese Candlestick reversal signal is a visual identification of a change in investor sentiment. Of the 50 or 60 Candlestick signals, there are 10 major signals that occur at the reversals the majority of the time.
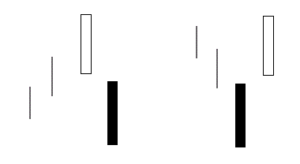
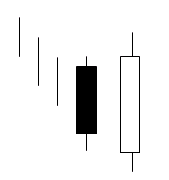
The Morning Star signal is one of the most clear, symmetrical candlestick reversal patterns.
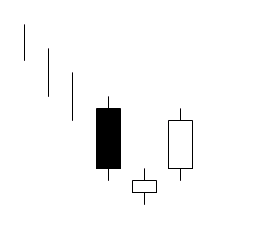
Morning Star
The Japanese rice traders described it as the planet Mercury, the morning star. It foretells that brighter things, sunrise, is about to occur, meaning that prices are going to go higher. It is formed after an obvious downtrend. The three day signal consists of a long black body, usually one produced of the fear induced at the bottom of a long decline. The following day gaps down. However, the magnitude of the trading range remains small for the day. This produces an indecision type – day. The third day is a white candle day. The white candle represents the fact that the bulls have now stepped in and seized control. The optimal Morning Star signal would have a gap before and after the star day.
The make up of the star, an indecision formation, can consist of a number of candle formations, however a Doji or a spinning top is usually the predominant formation in a Morning Star signal. The important factor is to witness the confirmation of the bulls taking control the next day. That candle should consist of a closing more than half-way up the black candle of two days prior.
Identifying the Morning Star signal is relatively easy. It is visually apparent to the eye. There are some very simple parameters that can enhance the Morning Star signal’s probabilities of creating a reversal.
- The longer the black candle and the white candle, the more forceful the reversal. This demonstrates a more severe change in investor sentiment.
- The more indecision that the star day illustrates, the better probabilities that a reversal will occur, such as a Doji signal.
- A gap between the first day and the second day adds to the probability that a reversal is occurring. A gap before and after the star day is even more desirable.
- The higher the close of the third day, coming up past the middle point of the black candle of the first day, reveals more potential in the strength of the reversal.
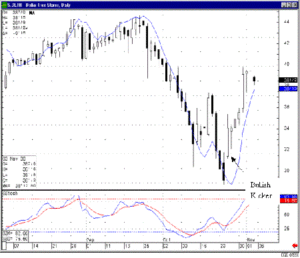
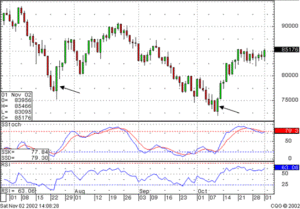
The probability of a Morning Star signal reversing a trend becomes extremely high when found in oversold conditions. Using a simple indicator such as stochastics, in the 20 area or below, represents an oversold condition.The most important element of the signal is the magnitude of the white candle’s close during the third day.
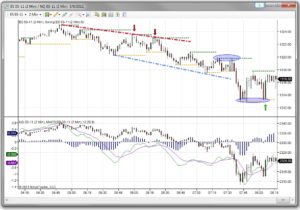
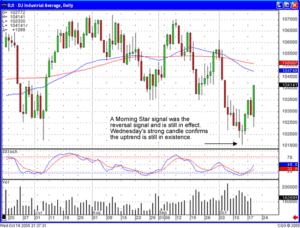
Candlestick analysis can be used in all trading entities. Whether doing a long-term evaluation on a monthly Dow chart or a one minute chart trading the e-minis, the signals working just as effectively for revealing change in investor sentiment during that time frame. As seen in the daily Dow chart, the Morning Star signals revealed when the Dow established a bottom. Being able to analyze the direction of a DOW l increases the probabilities of being a correct trade when analyzing individual stock charts.
