Bad commodity trading habits lead to bad commodity trading results. Beginning traders will often start with simulation trading and they will do great. When they switch to real time commodity trading the same folks who posted record profits in the simulation world will crash and burn. There are a number of reasons for on onset of bad commodity trading and these reasons are not just limited to beginners. Trading psychology has a lot to do with good habits turning into bad commodity trading habits. The old enemies of commodity trader, greed and fear, are not a problem when trading is not “for real” but raise their ugly heads at the thought of making or losing real money. To help avoid bad habits that lead to bad commodity trading it is useful to take Commodity and Futures Training. It is also very wise to learn, practice, and use the time honored technical analysis tools that made rice traders rich in ancient Japan. Candlestick basics originated over three hundred years ago and this very insightful, very visual system of following the commodity market can lead to very positive results. Using Candlestick charting techniques and Candlestick trading tactics can help the trader stay away from the bad habits that creep into the best commodity trading strategy.
Simulation or “paper” trading is basic to learning commodities trading, options trading, stock trading and the like. Trading software will have historical data that will allow the trader to work in “real life” trading situations. Using the time and psychological space afforded by these practice sessions the savvy trader will develop a sound trading strategy that can carry over to live commodity trading. Experienced traders will typically trade the same in simulated settings as they do in live trading. The trap that will lead inexperienced traders into bad commodity trading decisions is the impulse to “wing it” once in a live situation. Here is where the use of a tried and true set of technical indicators is necessary. Here is where learning the indicators and using them is critical. Use of Candlestick pattern formations to predict the commodities price movement has worked for over three centuries.
When the inexperienced trader enters into the real world of commodities trading is the time to apply what he or she has learned about the use of Candlestick analysis and not to forsake it. An excellent rule for a beginning trader to follow is that if you don’t understand the trade, don’t get into it. Commodity trading is not gambling. Because trading history repeats itself the use of Candlestick patterns gives the trader a very reasonable expectation of making a profit on a trade. What is required is the discipline to apply what is known at the right time. Using a well thought out trading strategy will lead to profits. Using the right tools to make a profit reinforces the use of the strategy. When the trader loses money on a trade when he or she did not expect to it is time to reevaluate trading strategies, not to wing in on the next trade. Practicing good trading habits leads to good commodity trading and letting fear and greed get in the way leads to bad commodity trading. Good trading goes with good management of investment risk. Setting limits and keeping track of both success and failure will lead to good long term results.
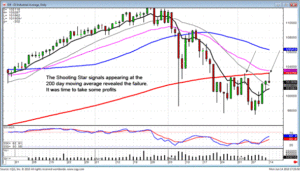
“Watch what it does when it gets to the next moving average!” This is the statement most often expressed when analyzing the charts on Monday and Thursday night training sessions. What is the significance of this statement? Prior to you learning candlestick signals, you might have had to wait a few days to see whether a resistance level was going to act as a resistance level or not. Most investors that do not have candlestick signal knowledge. That means they have to wait two or three days to see what is happening at a support or resistance level. Candlestick signals provide that same information instantly. As witnessed in todays trading, the Dow went up and touched the 200 day moving average, the suspected target, and then started fading back. This becomes a good of where and when to take profits.

DOW
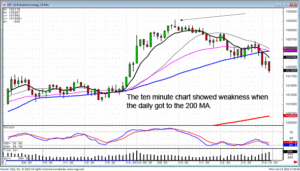
If a price move hits a potential target and does not seem to show enthusiasm about pushing through, take some profits, especially on charts that appear to be also showing a lack of enthusiasm. If the smart traders can see profit-taking going on at a resistance level, they will be taking some profits also. The worst-case scenario would be to buy back into positions where their charts showed strength and the indexes revealed they were coming back up through the resistance level. Once again, the advantage is still in the hands of the candlestick investor because they can identify what prices were actually doing at the resistance levels. This would both be applicable on the daily chart as well as seeing what was going on on the five minute chart or the 10 minute chart.

Dow 10 min chart
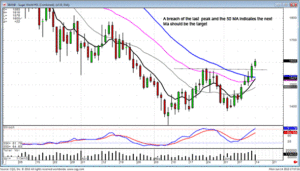
Candlestick formations reveal whether prices will resist or breakthrough a resistance level. If prices break through, there is a much different anticipation. As illustrated in our recommendation to buy July sugar today, the fact that the rounding bottom patterns broke out through the beginning of the pattern as well as the 50 day moving average at powerful implications. There was going to be more upside. What becomes the next potential target? The 200 day moving average! Will it get there in one move? Probably not, however knowing the price is probably in an uptrend, it now becomes much easier to anticipate what type of pattern setups might occur. There may be a J. hook pattern forming some time before the price gets to the 200 day moving average.

July Sugar
Candlestick signals provide an immense amount of common sense information. If you want to gain an advantage when you are investing, to trade without the knowledge of what the candlestick signals reveal is putting somebody else ahead of you. The candlestick investor is provided with a much easier trend analysis process when they understand what each signal represents and how to use them successfully with confirming indicators. The more information you can put into your analysis, the higher the probability you’ll be in a successful trade.
Chat session tonight 8 PM ET
Good Investing,
The Candlestick Forum Team
July 2010
Candlestick Technical Analysis Webinar – July 10 & 11
Options Training Webinar – July 31st & August 1st
Ultimate Candlestick Training Package – ON SALE!
Website special reflects current newsletter. If you are reading an archived newsletter you will be directed to Current Website Special.
Speak Your Mind