A means of profiting from price changes in commodities and stocks as well as stock indexes is by buying futures contracts. Unlike buying calls or buying puts in options trading, buying futures obligates traders to buy the stock or commodity on the contract settlement date. Unlike options contracts a futures contract is not executed at midpoint in the contract. However, a trader can sell in order to exit contracts on futures exchanges at any time that the futures price is profitable or any time that he wishes to eliminate the risk of holding the contract to settlement. The vast majority of those buying futures contracts will exit the contract by executing the opposite trade.
Those companies dealing in commodities will coming use buying futures and selling futures as a hedging strategy in order to guarantee a future sale or purchase price. In buying futures a trader is buying a derivative contract based upon the equity or commodity that underlies the contract. In buying futures on stocks, stock indexes, and commodities the trader assumes a long position. The price of the futures contract is determined by the market for the underlying. This price will fluctuate with current market price and expectation of the price at a date in the future. The use of technical analysis tools such as Candlestick analysis is important in reading market sentiment and anticipating price movement of both the underlying stock and the stock price as of the settlement date.
Many underlying elements of buying futures are not stocks and not really commodities either. They may be financial instruments, stock indexes, interest rates, and even such esoteric things as cap and trade futures. In each case the futures price will vary based upon underlying conditions and traders who successfully use technical analysis with Candlestick chart analysis can prosper by accurately predicting where the price or value of the underlying element will go in relation to its price when the contract is made. Although the settlement date of a futures contract may be weeks, months, or even years in the future the contract’s value or price can fluctuate by the minute as market conditions dictate. These contracts are traded on formal exchanges in set amounts with set contract settlement dates. As in all stock trading the fundamentals of the market are generally known and it is the stock price configuration that the trader reads with Candlestick chart patterns that gives profitable clues to where the stock price and stock futures price is going next.
Keys to success in buying futures are competent fundamental analysis of the underlying equity or index as well as up to the minute technical analysis with an easy to read tool such as Candlestick analysis. Knowing fundamentals gives the trader or investor a clear view of the potential of the stock market or of a given commodity such as corn futures. Knowing how to use Candlestick chart formations to anticipate future prices lets the trader profitably buy futures and sell futures whether for underlying stocks, commodities, indexes, or other, more esoteric, things such as index futures.
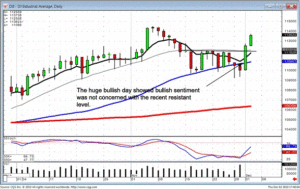
Candlestick analysis allows an investor to analyze the most basic investment decision-making tool, the market indexes. The premise of candlestick analysis is the evaluation of what investor sentiment is doing. Investor sentiment can be identified in the market in general, all the way down to the 1 min. specifics of an individual stock. Knowing the direction of the market indexes provides an extremely powerful profit force. As witnessed in the Dow during the past two days, there has been a noticeable change of investor sentiment. What had been a whipsaw market, a sideways moving market, had now been exposed as a new trend.

DOW
The significant factor of the bullish candle is that not only had a huge price move, but it closed above the top of the recent congestion area. This has significance! Everybody could see there was a resistance level and a close above that resistance level now provided new information. The Bulls were not stopping at the resistance level. That may seem very simplistic but candlestick analysis help perform analysis in as simplistic a manner as possible. Trading above a resistance level, and also above the tee line, makes for a very simple trend analysis. The trend is now in an uptrend. With that information, positioning the portfolio in the proper direction allows for the makeup of the small losses that may have occurred when the market was not showing a definite direction.
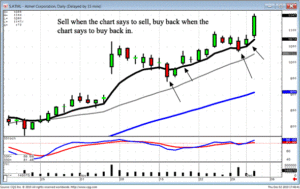
Many investors have a difficult time comprehending one aspect of investing. There will be times in the market when money will have to be at risk based upon what the candlestick signals are revealing but also will have to be closed out quickly because of a quick change in what the candlestick signals are now revealing. This comes back to the Sage advice, “Cut your losses short, let your profits run.” Using candlestick signals correctly will greatly eliminate the fear factor of looking stupid. Many investors have a difficult time closing out a position because it appears to be the time to close out the position but then witness new evidence that is time to be back in that position. Many investors take this as a personal affront. The stock does not like them! An easy way to eliminate that ill-conceived point of view is to ask one simple question. What is the chart telling me to do!
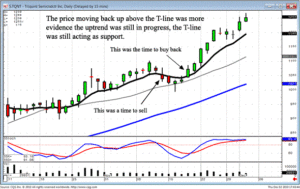
Note in the TQNT chart and the ATML chart, there was a time to close out the position, but there was also a time to immediately buyback that position. There will be times when one confirming indicator is breached but prices coming back up through the confirming indicator will now reveal other trend analysis factors as be in the predominant information.

TQNT

ATML
Chat session tonight at 8 PM ET
There will be a quick dissertation on how different stop loss procedures should be applied during different market conditions.
Good Investing,
The Candlestick Forum Team
Profitable Candlestick Trading – Book 1
Candlestick Signal Flash Cards – Set 1
Major Signals Mouse Pad
High Profit Candlestick Patterns – Book 2
Candlestick Patterns Flash Card – Set 2
Major Signals Mouse Pad
FAST-TRACK TRADING
Technical Analysis Training Package
1 Month Full Membership
Website special reflects current newsletter. If you are reading an archived newsletter you will be directed to the Current Website Special
Speak Your Mind