Commodity futures trading reacts to a broad range of factors. For example, crude oil has just fallen to a three week low. Today commodities traders are concerned that other nations will follow India’s example and raise interest rates. Higher interest rates tend to slow economic growth and the use of oil. Commodity futures trading in oil has dropped just over fifty cents for April delivery of benchmark light sweet crude whereas February 2012 delivery has dropped a dollar. Oil futures trading as far out as June 2016 is unchanged as traders still view the commodity as an inflation hedge.
Unlike oil, orange juice futures have gone up because of the frost in the worldfs second largest producing area, Florida. Now there has been a slight downward correction as the Department of Agriculture reports that the frost was not as bad as previously believed. In the case of oil the commodity market sees less use and is dropping the commodity price now and in future months. In the case of orange juice commodity futures are up because of decreased supply. To fully understand how commodity futures trading is affected by many divergent factors sign up for Commodity and Futures Training. Training will help you use both fundamental analysis and technical analysis with tools such as Candlestick charting to understand and predict the market in commodity futures trading.
Commodity futures trading in an organized fashion dates back at least 300 years to trading Tulip bulbs in Holland and rice trading in Japan. Candlestick basics, the basis of today’s Candlestick analysis, came into being in early commodity trading as rice traders recognized recurring trading patterns. Traders said that they learned to let the market tell them what the market was going to do. Today’s technical analysis with Candlesticks as well as other technical analysis tools in use today evolved from early, formal commodity futures trading. Today’s ability of the commodity trader to foresee commodity prices in oil futures or orange juice dates back to the actions of very thoughtful traders in the distant past.
Today analysts are saying that the fundamentals of the oil market do not justify prices above $80. The market already knows that! Many smart traders buy when they believe the price of a commodity future is cheap and sell when they think it is overpriced. The sum of these trades creates a market consensus smarter than any one individualfs market analysis. The extent to which commodity trading software is successful is the extent to which it follows tools such as Candlestick charting techniques which date back hundreds of years. A computer may be able to do the calculations faster but the computer did not have the wisdom to develop a system that can so accurately predict the future in commodity futures trading. So, as you are drinking your watered down orange juice (Tropicana is planning on putting only 59 ounces of juice in its 64 ounce containers.) and practicing the use of Candlestick chart analysis donft forget to thank those early rice traders for envisioning a system that so accurately predicts where commodity investing is going next.
Market Direction
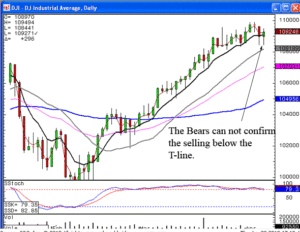
The markets continue to provide a consistent message. The Bulls continue to control the market! Wednesday was the first day in over six weeks that indicated the Bears might be stepping in. The Dow closed right on the tee line while the S&P 500 and the NASDAQ formed Doji’s. The weaker open today provided strong evidence the sellers were continuing to take over. However, by the end of the day, it was evident the Bulls were stepping back in. This may seem like an elementary observation after the fact but there was more important implied information. Every time the markets have tested the tee line, there is no confirmation that continues to push the market down through that level.

DOW
The continuation of the uptrend has strong ramifications for the candlestick investor. Many chart patterns are now breaking out to the upside due to the lack of negative sentiment. This information is especially important for the candlestick investor. It allows for the continued participation in pattern breakouts that are going to produce much stronger returns than the normal uptrending stock.
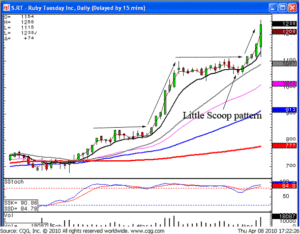
RT was recommended today due to the flattened scoop pattern. The price move above the $11 range gave the impression that another wave was about to start. Knowing what the results should be from a pattern makes the decision to enter or exit a trade much easier. Simple candlestick signal entry strategies provide a trading format that allows an investor to dramatically improve the probabilities of being in the right trade at the right time.

RT
Today’s entry into RT was relatively simple. The recommendation to get into this position was based upon the potential of another wave beginning. It opened lower . There is a very simple strategy for improving the probabilities of entering a trade at the appropriate time. When the price opens lower in a potential uptrend, set your buy stopped at the previous day’s close. The Japanese rice traders rationalize that the early profit-taking, causing the lower open, would be over if the Bulls could bring it back up through the previous day’s close. Obviously a lower open that did not have enough strength to come back up through the close of the previous day would not be a position that would convey strength.
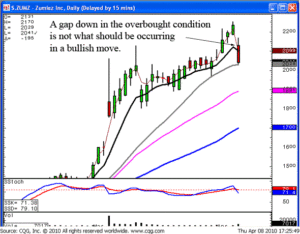
The same simple logic can be used for taking profits. Knowing the simple rules of candlestick analysis allows an investor to maximize potential returns. As seen in the ZUMZ chart, a recommendation to buy from a few weeks ago, did not exhibit the appropriate direction that would indicate Bulls were in control. A gap down below the previous day’s open, especially in an overbought condition, would immediately indicate the Bears have taken control.

ZUMZ
An open, below the previous day’s open, has the potential of creating a very strong sell signal, the kicker signal. With that knowledge, upon seeing a position gap open should instigate an immediate action, sell as fast as possible! Candlestick analysis is nothing more than common sense observations. The Japanese rice traders discovered centuries ago how investors think. When that is put into a graphic depiction, an investor gains immense control of their emotions and their profitability.
Chat session tonight at 8 PM ET. Learn how to identify breakout moves for big profits or daytrading scalping.
Good Investing,
The Candlestick Forum Team
Scanning Techniques to Higher Profits
Website special reflects current newsletter. If you are reading an archived newsletter you will be directed to the Current Website Special.
Speak Your Mind