Knowing commodity trading patterns allows traders to anticipate the markets in commodity futures. Successful commodities trading is based upon fundamental analysis of the commodity you wish to trade. It is also based upon astute technical analysis of technical analysis charts. Using technical analysis tools such as Candlestick pattern formations allows the trader to predict future market movement and market reversal based upon past and current market action. Commodity and futures training will help the new trader understand and use Candlestick charts and Candlestick charting techniques to make money in a commodity market.
Longer term commodity trading patterns will vary among commodities. For example, gold bullion prices and gold bullion futures will vary with the economy. Corn futures will vary with the weather and crop forecasts. They will also vary by season. The different fundamental analysis of these two different commodities is based upon their being totally different entities. Other precious metals will commonly trade like gold does. Industrial metals such as copper will trade with the rise and fall of the global economy. The commodities markets in wheat, rice, live cattle or other agricultural commodities will trade seasonally and will rise and fall with the ability of the agricultural industry to produce and ship food throughout the world.
Many commodity trading patterns, especially the seasonal agricultural ones, are unique to those commodities and are more closely tied to the fundamentals of the commodity than to the technical aspects of market reaction. However, the bulk of commodity trading patterns are really the same ones seen in trading stock and trading options. An example is the head and shoulders pattern or the reverse head and shoulders pattern. The head and shoulders pattern signals a market reverse of an equity on an upward trend towards a downward trend. The reverse head and shoulders pattern signals a reversal from a downward trend to an upward trend. Although a persistent drought in a major agricultural producing area may well drive up prices the various interpretations by many traders will cause market fluctuations superimposed upon an underlying trend. Understanding commodity trends, both large and small, will allow traders to profit both from long term market trends and the market inefficiency that result from important new news and market disruption.
One factor that affects commodity trading and commodity trading patterns as opposed to trading in another equity market is hedging. The biggest actors in the commodity markets are typically the producers and buyers of commodities. In fact, commodity markets had their beginning as a place for producers and buyers to come together and agree on future prices that protected each from catastrophic loss in case of a large change in market prices. Rice traders in ancient Japan used Candlestick basics to profit from market movements in rice. Learning through commodity and futures training how to do Candlestick chart analysis and use Candlestick trading tactics will profit the trader in both the short and long run. It is all about leaning the basics, applying them, and maintaining discipline in using commodity trading patterns.
Market Direction
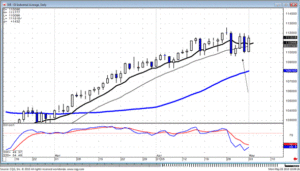
What is the market telling us? The past five days of trading have shown severe whipsawing. As can be seen on the Dow chart, there have been huge down days followed by huge up days. This makes trading difficult. Obviously, it makes analyzing what is occurring in investor sentiment very difficult to interpret. This is usually an indication there is going to be some dramatic change. In the case of the Dow, after a very steady uptrend, the severe oscillation in investor sentiment is probably an indication that something is going to move the markets in a more dramatic fashion than what has been experienced over the past two months.
Is this a top or is this a resting phase? By analyzing the charts, that cannot be answered. What should be the strategy when this market condition occurs? The point of investing is to analyze indicators that have shown a proven probability for the next move. The use of the tee line has been very effective until the past few days. The uptrend remained in progress as long as there was no close below the tee line. The Doji, followed by a large bearish candle that close below the tee line, indicated there was a change of investor sentiment. The past four trading days has revealed investor sentiment is wildly uncertain. For current trading, it is very difficult to make a profit. That is when an investor should observe the obvious. If market conditions cannot be analyzed to the degree where it gives you the edge, then you should not have your money exposed. Sit in cash or at least have the portfolio positions to where half is in long positions, the other half is in short positions.

DOW
No matter what market conditions are prevailing, the candlestick signals and patterns can produce a number of bullish or bearish potentials. A sideways, choppy market will allow both longs and shorts to be profitable at the same time. This requires one simple analysis. Which long positions continue to show strong charts? Which short positions continue to show week charts? There will be profits made on both sides when the market is predominantly moving sideways.
When the investor sentiment starts to become volatile, it reveals a potential change. This provides a self fulfilling discipline plan. The lack of identifiable direction creates the conditions to be sitting heavier in cash. Thus, when the market does reveal what it plans to do after an indecisive stage, the candlestick investor has heavy cash allotments available. A sideways moving market also allows price patterns to continue to formulate. Watching which trading patterns are setting up doses immediate profitable opportunities in the market does choose the next direction move.
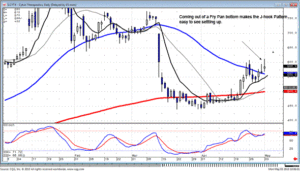
CYTX was a recent recommendation. It had the evidence of a strong price move coming out of a frypan bottom. The resistance level, the 50 day moving average, was the first logical spot to take profits. As the markets in general have moved sideways over the past five trading days, CYTX has continued to set up a J-hook pattern. This becomes a very simple entry decision.

CYTX
If the markets/Dow break itself out of the consolidation stage, the anticipated bullish sentiment would continue confirming the J-hook pattern. Piecing simple common sense deductions together, based upon expected market movements, produces an analytical format that makes identifying high profit situations much easier to evaluate.
Chat session tonight at 8 PM ET.
Good Investing,
The Candlestick Forum Team
Projecting Price Targets – Quickly learn to spot the most profitable price targets! – BONUS EBOOK with purchase!!!
Website special reflects current newsletter. If you are reading an archived newsletter you will be directed to Current Website Special.
Speak Your Mind