In trading commodities traders follow trends, anticipate market reversal, and use technical analysis tools such as Candlestick chart patterns to trade successfully when a commodity establishes itself in trend or a trading range. Commodity trends vary with the type of commodity. Trends differ over short or long term. However, technical analysis with Candlestick charting will predict future market moves as successfully with corn futures or gold futures as it did in the rice market in Japan during the reign of the Samurai. Trading of commodity trends can be very successful so long as the trader uses both fundamental commodity analysis and technical analysis indicators to verify the probability of the trend lasting or reversing. Learning how to trade commodity trends and market reversal is part of commodity and futures training.
Commodity prices and commodity trends are based on the laws of supply and demand. However, when the exact supply and the exact demand are unknown the market will speculate. Knowing the fundamentals of how a commodity is produced and the depth and breadth of its market is essential to successful commodity trading. Knowing the fundamentals always helps the trader reduce and manage investment risk. However, to profit from trading futures in commodities the trader will need to be able to read the market. Trends tend to establish themselves when the market is in consensus about the prospects of a commodity price. When a recession hits traders in oil futures will want to sell short on the way down and will continue to do so as long as they believe that the price has not reached a fundamental support level. Understanding support and resistance zones is essential in successful trading of commodity trends. With knowledgeable use of Candlestick trading tactics a trader can do well trading commodity trends or predicting and profiting from breakouts.
Long term trends are essentially an organic part of a market. For example, the development of a new seed variety may substantially increase corn production and cause a long term decrease in the price of corn futures. On the other hand a drought in a major crop growing area will probably only raise prices for a year or until the next rains. Knowing and understanding the nature of trends will help the trader profit by them. The longer term trends are typically due to fundamentals. Short term trends in commodities or other trading are typically due to market sentiment. In reading market sentiment the trader will rely on Candlestick analysis to let the market tell him when the market will do. Everyone has the same fundamental information but everyone buys or sells a little differently. The psychology of the market is such that commodity trends feed upon themselves, almost to excess. Knowing when to stay with the trend when to go against it comes with experience and the use of tried and true trading tools such as Candlestick basics. What worked for Japanese rice traders centuries ago can work for traders today.
The major benefit of candlestick analysis is that it can accurately evaluate all markets and all time frames . For the active trader, this is very important information. If you love trading stocks, you have a relatively large market to deal with. However, most of the active trading occurs in the first hour and a half in the final hour. The market trades relatively blasé during the middle part of the day. For an active trader, this can be a problem. Wanting to trade actively during the middle part of the day may lead to pushing trades that should not be executed just for the sake of staying active. There are better solutions.
Commodity markets usually open up 30 minutes to an hour after the stock market opens. They usually close prior to the close of the stock market. This allows a trader to trade actively during the first and last hours of the stock market trading, then participate in some commodity trading during the middle part of the day. This allows the active trading to be spread over the full length of the day. Fortunately, successful commodity trading utilizes the same confirming indicators as stock trading. The charts work equally well on bond charts, currency charts, or any other trading entity that involves human participation.
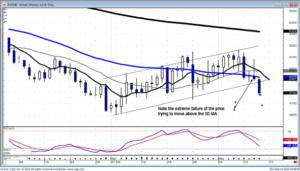
Investing successfully in commodity charts is very simple. It takes the same logic and visual analysis found in stock charts. For example, July Wheat was shorted today based upon a few simple chart analysis techniques. A failure of the 50 day moving average yesterday was an indication to watch for further weakness today. If that happened, the trend channel would be breached. This would set up the possibility of a strong leg to the downside.

Wheat
Having the ability to recognize when a high probability trade is going to occur creates the opportunity to make much bigger profits trading commodities than trading stocks. The leverage in commodities make say price move extremely worthwhile.
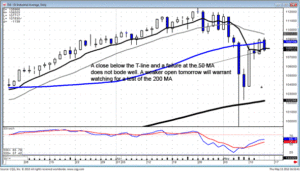
The Dow held up well today after a few days of strong buying for the most part of the day. The immediate consolidation took the Dow back down to the tee line first thing in the morning. It acted as support. The rest of the day traded relatively strong, considering there was a good amount of profit taking occurring today. The selling strength returned going into the close. This makes the prospects of a strong recovery in the markets more dismal. However, the strong charts still revealed continued strength. Because of the severity of the last downtrend, when buyers came back into the markets, they did so with an extensive amount of enthusiasm. This can be seen in the number of candlestick reversal signals and gap ups in price.

DOW

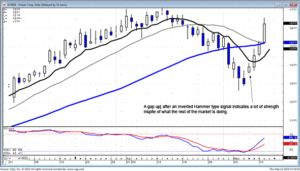
RHT
Utilizing these simple rules helps an investor trade much more calmly. Many investors get scared out of a trade that is not producing a true reversal signal. They will not attempt to get back in because it would make them look foolish to sell out and then buy it right back. Using the simple rules applied to candlestick signals in the confirming indicators keeps an investor from entering a trade they should not get in and keeping them in trades they should not get out. This benefit allows an investor to concentrate their efforts on analyzing for new trades. Mental time and effort will not be wasted on price trends that are just zigging when the uptrend is still in progress. The benefits of these techniques are more apparent when trading commodities. Small price moves in a commodity trade equats to great differences in profits or losses. Learn how to apply simple trading rules to your investing and you will gain a much better comprehension for when trending prices are merely having small pullbacks.
Commodity traders — Do you know how to evaluate which trade or trades have the highest probabilities of producing profits? Have you ever analyzed two trades that look good. You decide upon placing a trade in one. It doesn’t move, but the other one takes off like a rocket. What could you have done to decipher which one was going to have the greater probability of moving. Not only moving, but moving with a much greater strength. The Candlestick Forum will be providing a two-day commodity trading training session. Candlestick signals makes the opportunity for improving your returns for stock trading dramatically better. Using candlestick signals in commodity trading greatly improves the potential of making huge profits. Join us on May 22 and 23rd for a concentrated two day training session for successfully trading commodities. The analytical techniques found in his training will improve all aspects of your candlestick investing.
Chat session tonight at 8 PM ET
The Candlestick Forum Team
Projecting Price Targets – Quickly learn to spot the most profitable price targets! – BONUS EBOOK with purchase!!!
2-Day-Commodity Training Webinar
Website special reflects current newsletter. If you are reading an archived newsletter you will be directed to Current Website Special.
Speak Your Mind