Trading a consolidation pattern can result in substantial profits in trading stocks, trading futures, trading options, and trading commodities as well. When the market is coming to a consensus on the value of an equity it often generates a price chart that seems to oscillate above and below a given price. That price median or average price may be stable, trending up, or trending down. The point is that the stock price and other price swings above and below the mid range will tend to tighten up. The market is consolidating its opinion regarding the equity. At first glance this would seem to be the time to get out of the stock, commodity, option, or futures contract. If the equity is trading sideways, where is there any profit? Technical analysis with time honored technical analysis tools such as Candlestick patterns may tell traders that such a consolidation pattern may well be a prelude to a substantial upside breakout of stock price, commodity price, futures price, or option premium price.
Although a consolidation pattern results from market indecision it ends up with market consensus. A consolidation pattern may be superimposed on upward market trends. This kind of pattern can also be a prelude to market reversal. Knowing Candlestick analysis helps the trader anticipate just where the apparent market indecision is going to lead. Buying at the bottom of a downward trending stock price can lead to substantial profits for the trader who accurately reads the Candlestick chart patterns suggesting a consolidation pattern and uses discipline in trading the same. A consolidation pattern evolves as traders using fundamental analysis recognize the basic support and resistance zones of a stock or other equity. As technical traders read this price action they will anticipate price turnarounds and may, in fact, help to shrink the range between highs and lows even more. It comes to a point where the use of fundamental and technical analysis makes it clear to savvy traders that the equity’s basics and the sentiment of the market will support a higher (or lower) price. Then there is typically price a breakout and a substantial run up, or down. Using Candlestick pattern formations as a guide the trader can often gain profits from the accurate reading of a consolidation pattern.
There are a number of consolidation patterns, none exactly the same. As with trading all patterns the trader who first recognizes where the pattern is leading to may well be the one to make the most profit. Unfortunately, the same trader is opening himself up to losses if, in fact, he misreads what is happening and sees a consolidation pattern where none exists. The conservative trader will seldom over read a pattern but may be the last one in to a market swing and, thus, realize less profit. In both cases the trader is wise to set his stops as he makes his trade, follow the trend, and adjust stops along the way. The wise stock market, options market, commodity market, or futures market trader will continue to use Candlestick charting as a guide as the pattern and its breakout progresses. Learn technical trading with Candlesticks and take advantage of market indecision, market consolidation, and potential price breakouts.
Market Direction
Utilizing candlestick signals provides one huge advantage. They show you when it is time to buy. This also includes what to do after a price as opened much higher. There is valuable information built into the signals and each individual candlestick formation. Fortunately, the analytical tool for assessing what each signal/formation is revealing requires nothing more than common sense. Whether analyzing the market trend in general or looking for specific stock breakout patterns, candlestick analysis becomes mastered by merely recognizing reoccurring price patterns.
Remember how difficult it was to memorize facts, maps, figures, or historical events in school? The difficulty came from questioning how useful that information was going to be for our future. Most of it was boring. Candlestick charts have a completely different result. Memorizing and understanding the chart patterns is going to create high probability big dollar trades.
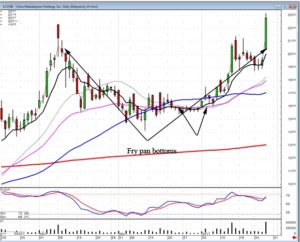
As can be seen in the CCME chart, the open gapped up approximately 4%. One of the first questions from our chat room was “Is this open to big to be buying at these levels?” This is where recognizing the chart patterns becomes extremely valuable. Not only the longer term chart pattern, but also the immediate chart pattern. Note how the price of CCME had been drifting sideways and slightly down for the past two weeks. Once the T line caught up, a Morning Star signal appeared. Under these conditions a very simple but highly expected result occurs. The price moves up as if it had a slingshot effect coming out of a mini scoop pattern.
The analysis becomes relatively easy. A Morning Star signal at the lower end of a down sloping trend requires confirmation. A gap up in price is a very viable confirmation. What does it mean when a price after a candlestick reversal signal? The buyers want back into this position very aggressively. This is exactly the type of scenario an investor wants when establishing a position.

CCME
The longer-term analysis also aids in the evaluation of this trade. A huge Fry Pan bottom has developed since the early part of November. The price has also moved up from a Fry Pan bottom/Cradle pattern that formed at the end of December. What do we expect after a Fry Pan bottom? A very strong price move! What do we expect after a very strong price move? The possibility of a J hook pattern! After a pullback to the T line and the formation of a Morning Star signal appearing, what type of pattern would develop if the price move higher? A J-hook pattern! When the price opened higher today, gapping up, this leads to buying immediately. All the makings of a positive trade are in place. Will all trades move up dramatically in this type of situation? Definitely not, but the probabilities project moving up today or over the next four days is greatly improved when using the rules applied the candlestick analysis. This is the type of memorization you want to keep applying to your investment practices. The charts will demonstrate where high profit trades setups will occur just like they have done many thousands of times in the past.
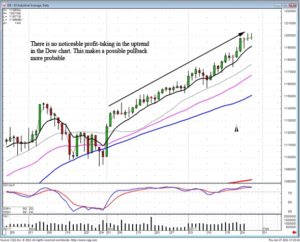
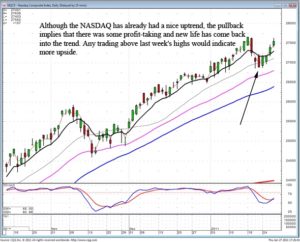
The Dow and the NASDAQ continued to show steady strength. The Dow would be more worrisome due to its lack of consolidation. However, this has been remedied with the NASDAQ pulling back a few days and starting back up, creating a market trend has taken some profits out and is now continuing the uptrend with new strength.

DOW

NASDAQ
The longer this market continues in a slow steady uptrend, the more compelling the reversal signal needs to be. A slow steady uptrend in the markets is very beneficial to the candlestick investor. It allows for price patterns to breakout for inordinate profits. The formation of each candle provides information on investor sentiment.
Chat session tonight at 8 PM ET – We will discuss the appropriate actions after big price moves, such as Netflix. The development of each daily formation allows an investor to create a game plan for whether to stay in or get out. Join us tonight for a look into big price move analysis.
Good Investing,
The Candlestick Forum Team
Speak Your Mind