What is a Day Trader?
A day trader is a type of trader who buys and sells financial instruments and then closes out of the market all within one trading day. A day trader may trade financial instruments such as stocks, options, currencies, futures, etc., and the trading strategy used by each individual trader will determine how many trades are made each day. This type of trading style is referred to as day trading. There are two types of traders who practice day trading including the retail trader and the institutional trader.
he retail trader either works alone or with a few other traders and typically trades using his or her own capital. These types of traders utilize the services of a stock broker however they are typically online brokers offering direct access to stock trading software platforms. This type of trader requires the use of fast order entry on the stock exchanges and many will opt to go with an online discount broker rather than a full-service broker.
The institutional day trader works for a financial institution and typically has a lot more resources as his or her disposal. Most of the time they have a team that supports them, a large amount of capital, very expensive and high-end trading software, and more leverage than the retail trader. This obviously gives them a small edge over the market especially considering that they have more funds available to them that allows them to trade more frequently on the markets. In the past before the advent of the internet, there were obviously more institutional traders than retail traders, however now popularity of the retail trader is growing more than ever. Anyone can now decide that they want to practice day trading stock online and for a living from the comfort of their own home.
Most day traders are knowledgeable and experienced in the market place, they have a trading strategy and they have adequate capital at their disposal. They understand their risk tolerance, and are very careful that they have the necessary capital to carry out effective intraday trading. There are many different trading strategies that are utilized when day trading stocks one of which is swing trading.
Swing trading is a trading style that aims to make gains in a stock within one to four days and not necessarily within the same trading day. Swing traders rely on short term stock movements and use technical analysis in order to trade stocks quickly. Technical analysis is the study or price trends and patterns. Technical analysts don’t care about the intrinsic value of stocks, like fundamental analysts because they believe that the value is depicted in the price movements. Fundamental analysis is often used by long term investors rather than for short term stock trading.
For those investors interested in becoming a day trader, continue to do research on the various strategies used by investors. There are many techniques available and the trick is to find an investing strategy that works for you. Join online forums, find a stock trading mentor, and practice as much as possible through online paper trading before attempting to trade with real money.
Market Direction
There are assumptions that can be made about market activity. These assumptions are based upon the reoccurring trading phenomenons that occur year after year. As mentioned in the last newsletter, this is the definition of seasonality. The benefit of knowing the different factors coming from seasonality is that it creates another element for being in the right positions at the right time. Do seasonality factors work consistently from one year to the next? Not always, but they occur often enough to have them as a recognized factor each year.
A simple assumption is that investor activity starts picking back up after the first of September. The kids are back in school. Everybody is back from vacation. The weather starts turning chilly. Investors are back at their desks ready to trade. There is a very simple method for recognizing whether the common price occurrences are occurring this year like they did in the past. Candlestick signals become a valuable tool for recognizing whether a seasonal pattern is about to occur again.
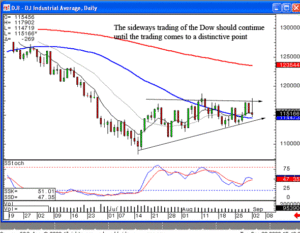
That philosophy can be put into the trend analysis of the markets in general. If the Labor Day weekend signals the end of the summer and many traders are coming back to their desks, they usually will have a more distinct investor bias. This is especially true if the market indexes have created some sort of pattern prior to everybody coming back to their desks. Unfortunately, the lack of direction can be further emphasized if the previous market conditions did not show any specific patterns up. The Dow has been trading sideways for the past two months. Today’s trading could have provided the message that new investor sentiment was coming into the market. That would have been illustrated by a strong bullish day, after last week’s attempt of a rally. However, the failure of the morning ‘buying’ merely signals that any new trading coming into the market was also cognizant of the previous flat trading.

DOW
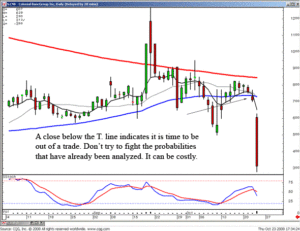
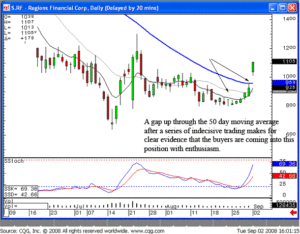
The continuation of a sideways mode is still very likely based upon the lack of direction today. Crude oil prices were trading Dow below the 200 day moving average. This should have been a great stimulus for the Bulls. When all factors continue to demonstrate the lack of enthusiasm for either bullish or bearish movement in the market, it has to be assumed that what ever ‘has been’ working or not working should still continue. The past few weeks has revealed strength coming into the financial stocks. Simple logic dictates that when many stocks in the same sector are moving well, that is usually an indication that the big money likes the sector as a whole. This may seem like a very simplistic statement but it becomes much more evident through the graphic illustrations of candlestick signals.

CNB

RF
Usually the first day after the Labor Day weekend is the beginning of the more heavily traded part of the year. There will usually be a signal as to what investors are feeling coming back from their summer vacations. Today’s trading started out very bullish but faded in the afternoon. This is an indication that the pre-existing sideways mode of the market is still in process. This makes some of the trading techniques very difficult to be profitable. As illustrated earlier in the summer, specific sectors may be bought but then held during the slow grinding market. Earlier in the summer, it was the oils that produced the profits. Currently, the financial stocks are showing strength.
Investing should not be a difficult endeavor. Candlestick signals make bullish and bearish pressure very obvious. Most technical trading methods use indicators that confirm the results of a price move. Candlestick signals provide the evidence that a price move is in the process and about to change direction. This allows for much better entries than those techniques established more for the confirmation that a trend has reversed.
Seasonality Presentation
Thursday September 11, Best Choice software will be presenting the benefits of utilizing the information seasonality conveys. Seasonality, just like candlestick signals, provides information to put the probabilities in the investors favor. Combining seasonality information with candlestick signal confirmation produces a powerful trading platform. Having the knowledge of when specific Stock prices or sectors will usually act the strongest, and then being able to confirm it was candlestick signals, dramatically improves the probabilities of being in the right places at the right time. Mark your calendar! This is information that you can use year after year.
No chat session tonight.
Good investing,
The Candlestick Forum Team
Website special reflects current newsletter. If you are reading an archived newsletter you will be directed to the
Current Website Special.
Speak Your Mind