Day trading, a trading technique popularized to the general investing public in just the past 5 to 7 years. This phenomenon resulted from the severe market daily declines in 1987 and a few in the early 1990’s. The huge down days made it impossible for investors to get in communique with their brokers. So, it was legislated that access to the markets had to be available to everybody, thus the electronic trading systems. Day trading blossomed in the early to mid 90’s.
However, the original day trading techniques, having electronic signals showing quick arbitrage situations, producing huge profits, has disappeared over the past two years. But day trading is still very profitable when used with candlestick signals. The old methods disappeared, but new products were developed that made day trading still viable. The exchanges set up market index trading entities. The Spiders for the S&P index, the Diamonds for the Dow and the QQQ’s for the Nasdaq. These highly liquid trading entities make for excellent trading vehicles for day trading.
Fortunately, candlestick signals clearly illustrate the change in investor sentiment for any time period; monthly, weekly, daily, hourly or by the minutes. A minute chart is valuable for the day trading technique. Combining stochastics with candlestick signals, even on a minute to minute basis, produces highly accurate results. Day trading has a very viable platform to work from when the signals and stochastics coordinate.
Producing the right combination of time segments can formulate low-risk, high potential day trading setups. For example, the active day trader may use the 1 minute, 3 minute and 10 minute charts to establish their trades. The 1 minute, 5 minute and 15 minute chart combination works extremely well. Other day trading programs, set for two or three trades per day, may use the 5 minute, 15 minute, one-hour combination.
Combining multiple charts creates a basis for catching the intraday trends. Day trading in this manner requires getting in and getting out of trades right at the reversal points. The candlestick signals provide this information. Day trading without a method to take advantage of accurate reversal signals produces much reduced profits. Day traders should utilize candlestick stock analysis for clear entry and exit strategies.
Note in the following example that observing all three charts may produce validity to a day trade. Day trading becomes easier when the visual road map can easily be determined.
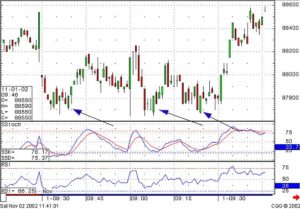
Note how the one minute chart of the S&P, a favorite of the day traders, keeps revealing candlestick “buy” signals at the same support area. Those signals would alert the candlestick investor to the fact that buying was clearly obvious every time the sellers brought the S&P down to this level. Day trading these “buy” signals would require some visual backup.
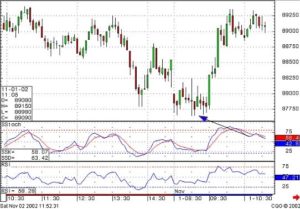
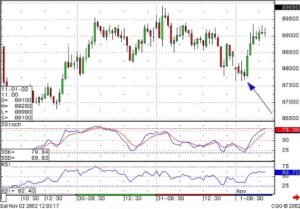
The five minute chart reveals the same factors. Oversold stochastics. The shadows are all showing support at that one level. The Spinning Tops are demonstrating indecision. Now the 15 minute chart should be perused.
This day trading technique can be applied to any trading entity that has sufficient volume. Using the signals at the proper stochastic period can produce consistent day to day profits. Mr. Bigalow has traded the S&P E-Mini’s for years. Use the forum, chat room or e-mail the site to learn more about how to use candlesticks with your own day trading program.
Other Day-trading articles of interest
The Dynamic Doji
One of the most revealing signals in Candlestick Trading
Effective Stock Market Trading Systems
Why try to swim against the current – Trade with the market trend
Speak Your Mind