Many investors do not like short selling. There is the stigma that short selling induces negative connotations and is Un-American. However, short selling is a vital part of market movements. It provides liquidity and stability in price movements. Short selling is also extremely profitable. The anguish of watching long positions go down is completely reversed with the exhilaration of knowing those prices going down are producing profits. The markets go up and down. Having the ability to identify those directions permits an investor to make profits in any market conditions.
Short selling greatly enhances returns. Price patterns that work extremely well as bullish indicators perform just as well as bearish indicators. Candlestick buy signals in an oversold condition produce an extremely high probability of producing an uptrend. Conversely, candlestick sell signals witnessed in overbought conditions produce extremely high probability that a downtrend is going to occur. Those signals/patterns, occurring with other technical indicators such as trend lines and moving averages, dramatically increases those probabilities. Short selling, when a candlestick signal appears in an overbought condition and at a major resistance level such as a moving average, becomes a very easy trade set-up to identify.
Dave Elliott of WallStreetteachers.com has produced some very simple and powerful observable trading patterns for short selling. His Blue Ice Failure pattern is an extremely high probability trade. Wouldn’t you like to be able to identify high probability reversal situations? David Elliott’s extensive research in price patterns does just that! What makes these patterns that much more easily to identify? The use of candlestick signals. The combination of price patterns and candlestick signals produces trade situations with a great degree of accuracy.
Blue Ice Failure Pattern
The pattern is aptly named in that it represents somebody falling through the ice, (the trend coming down through a major moving average such as the 50 day moving average.) They try to swim back up to find the hole that they fell through. When they cannot find it, they sink to the bottom.
This pattern becomes very easy to identify using candlestick signals. After the prices come down through the first major moving average, it will try to attempt breaking up through that moving average again. The failure of that breakthrough is the primary indication that a Blue Ice Failure is in progress. As the price approaches the moving average, candlestick sell signals such as Doji’s, Spinning Tops, and Hanging Man or Shooting Star signals appear at that level. This becomes an indication that the Bulls are being stymied at this level by the Bears. Once the Bulls realize they are not going to break through the moving average, they start liquidating their positions. This provides more confidence for the Bears.
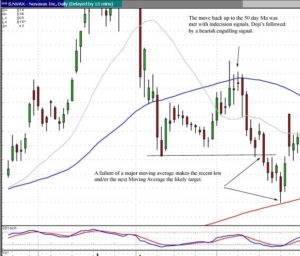
NVAX
Always keep in mind that the targets are high probability targets; establishing a short position puts the probabilities in the investors favor. The first target will be a test and breach of the recent lows with an additional probability of testing the next major moving average. As can be seen in the SIFY chart, the failure of the 50 day moving average it is a good indicator for short selling.
Speak Your Mind