It is often asked whether the candlestick signals are effective in long-term stock market predictions. Unfortunately, the answer to that is yes and no. Yes, in the sense that if the definition of long-term is two, three, or six months out in the future, the signals can be used on a monthly chart as effectively as they can on a one-minute chart. Keep in mind that the candlestick signals are the visual depiction of investor sentiment. Candlestick analysis is the evaluation of what the current and near future projected sentiment will be in a trend.
Stock market predictions of one year out into the future is not logical and any technical or fundamental analysis in this day of age. The reason is that with the information available on the Internet and TV on an instant access basis, investment decisions and psychology can change dramatically based on new information becoming available. To try to make stock market predictions for what will happen over the next 12 months is not a relevant exercise.
What looks to be a feasible projection today can easily be influenced by world events and/or the introduction of new competitive elements into a specific market. The purpose of candlesticks is not to project what will happen in a year from now, but to take advantage of what the investor sentiment is doing today. Today’s stock market projections can change dramatically at any point in time. The candlestick signals provide the opportunity to evaluate what investors are anticipating for the near-future. That short-term reversal signal may also alert the fundamental investor on new dynamics coming into the value of that company.
This makes candlestick signals an excellent timing factor for those that are investing in long-term fundamentals.
Market Direction
Another strong morning Star signal formed early this week in the Dow. The fact that the stochastics were on the oversold area in the morning Star signal was forming at approximately the same area as we are a double morning Star signal formed back in early August may just a very logical area to start buying.
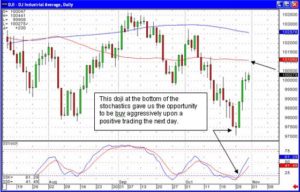
The Dow
That is why it was recommended to buy aggressively and in the pre-market comments the day after the doji formed. The current conditions of the stochastics indicate at the 50 day moving average 200 day should be the first target.
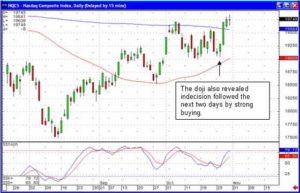
NASDAQ
At the same time, the NASDAQ also formed a doji and although the buying was not at the same magnitude as the Dow the next day, Wednesday confirmed the buying when the NASDAQ closed above the 200 day moving average. Additionally it closed above the last recent high of early October with the stochastics starting back up. It has been healthy to see the selling early in the morning followed by buying in the afternoon the past few days. It would not be unusual to see the NASDAQ consolidate back to the moving average early next week before it continued its uptrend.
A more general analysis was illustrating that the market was not selling off in general. This would have been evaluated in the fact that the NASDAQ was trading sideways while the Dow was in a three-week decline. The assumption would be that money was shifting from sector to sector, not coming out of the market.
Speak Your Mind