How to Trade the Bullish Harami.
Most stock market strategies involve complicated approaches and formulas. Candlestick analysis provides a platform for making stock market strategies very simple to implement. Unfortunately, most investors put money into the markets without any concern for stock market strategies. This not only skews many investors investment perceptions, it also delays the process for how to learn to trade the stock market correctly. Stock market strategies should be incorporated into an investors learning process from the very beginning.
Candlestick signals provide the information that can put investors on the right track from the beginning. Taking advantage of the investor knowledge incorporated into candlestick signals allows an investor to eliminate bad habits. Stock market strategies should involve investment programs that put the probabilities of being in a correct trade in an investor’s favor. To simplify the process, if an investor merely learns the 12 major candlestick signals, the correct investor habits will be much easier to implement.
Successful stock market strategies involve investment practices that can be accounted for and constantly improve. The 12 major candlestick signals provide a framework for establishing a high probability trades. They also convey to an investor when the investor sentiment is not working properly. Most stock market strategies pay little attention to procedures on losing trades. The candlestick signals provide an expected result. When they do not occur, losses can be cut short . Funds can then be moved on to high probability situations.
Utilizing the 12 major signals establishes a knowledge base for what should happen in the future. Knowing the investor sentiment that developed the signals provides a much better insight for investors to determine successful trade situations. The Bullish Harami is an example of visual statistic analysis. Upon witnessing a bullish Harami at the end of a downtrend, an investor has a good idea of what to expect. This major signal becomes a vital information packed analytical tool.
HARAMI
BULLISH HARAMI
Description
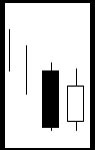
The Harami is an often seen formation The pattern is composed of a two candle formation in a down-trending market. The body of the first candle is the same color as the current trend. The first body of the pattern is a long body, the second body is smaller. The open and the close occur inside the open and the close of the previous day. It’s presence indicates that the trend is over.
The Japanese definition for Harami is pregnant woman or body within. The first candle is black, a continuation of the existing trend. The second candle, the little belly sticking out, is usually white, but that is not always the case. The location and size of the second candle will influence the magnitude of the reversal.
Criteria
- The body of the first candle is black, the body of the second candle is white.
- The downtrend has been evident for a good period. A long black candle occurs at the end of the trend.
- The second day opens higher than the close of the previous day and closes lower than the open of the prior day
- Unlike the Western “Inside Day”, just the body needs to remain in the previous days body, where as the “Inside Day” requires both the body and the shadows to remain inside the previous days body.
For a reversal signal, further confirmation is required to indicate that the trend is now moving up.
Signal Enhancements
- The longer the black candle and the white candle, the more forceful the reversal.
- The higher the white candle closes up on the black candle, the more convincing that a reversal has occurred despite the size of the white candle.
Pattern Psychology
After a strong down-trend has been in effect and after a selling day, the bulls open the price a higher than the previous close. The shorts get concerned and start covering. The price finishes higher for the day. This is enough support to have the short sellers take notice that the trend has been violated. A strong day the next day would convince everybody that the trend was reversing. Usually the volume is above the recent norm due to the unwinding of short positions.
Learning the 12 major signals makes the analysis of market trends and price trends very easy. They use of candlestick charts greatly enhances the speed in which somebody can analyze a trend correctly. The candlestick patterns are graphic statistical analysis. Japanese Rice traders have successfully use the signals for centuries. Learning how to invest in the stock market becomes much easier when you got the probabilities put in your favor.
Speak Your Mind