The ultimate poop trade! Technical analysis of stocks become much easier when able to interpret what investor sentiment is demonstrating. Candlestick analysis incorporates common sense investor concepts into graphic depictions. Understanding how to interpret what investor sentiment is doing after specific market movement will greatly enhance your profit potential.
The technical analysis of stocks present a multitude of price movements. A highly profitable opportunity is usually presented in bad news gap-downs. Consider the following situation. You just recently bought a position because of a very good bullish signal. All confirmation is positive, it moves up nicely the first day. THEN, the dreaded news; the company issues an earning warning, the SEC announces a surprise audit, a contract gets cancelled. Whatever the news, the price drops 20%, 30% or greater. The question is what to do now? Do you sell the stock, take a loss and move on? Do you trade it at the new levels? Do you hold and/or buy more at these levels? What is the best course of action?
Traders and long term investors will have completely different outlooks. The traders bought the stock a few days back due to specific parameters for making that trade. They should consider liquidating the trade immediately and move their money to better probabilities. The reason for putting on the trade, for a short term trade, has completely disappeared after the massive down-move. The longer term investor has a few more analytical options for gap analysis. They may want to hold the position because the Candlestick formations indicate that the price will move back up or liquidate because the Candlestick signal shows further decline. Reading the signals becomes an important element in knowing what to do in a “bad news” situation.
A “bad news” gap-down has a multitude of possibilities after the move. The prior trend gives you valuable information on how to react to the move. Of course, the news is going to be a surprise or there wouldn’t be the gap-down. Analyzing the trend prior to the move gives you a good idea of how much of a surprise the announcement or news bulletin is.
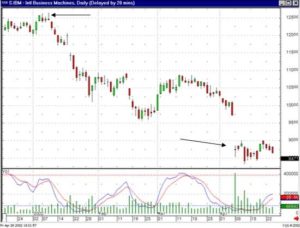
For example, IBM recently reported lower earning expectations. The price gapped down. However, you have to analyze whether this news was a complete surprise or whether the gradual decline in the stock price was the anticipation of the coming news. As can be seen in the IBM chart, the price had been declining for three months before the actual news was announced. The smart money was selling from the very top, months ahead of time. It was the die-hards that held on until the bad news was reported.
As the chart shows, the final gap-down produced a Long Legged Doji, massive indecision. From that point the buyers and the sellers have held the price relatively stable for the next few weeks. This now becomes one of the few times that a technical analysis has to revert back to fundamental input. Unless you believe that the markets in general are ready for a severe downtrend, consider what the chart is telling you. The price of IBM stock was reduced from $125.00 per share down to $87.00 per share. The last down-move produced a Doji. The price has not moved from that level for two weeks.
IBM
Now, the fundamental input. IBM is a major U.S. company, well respected, and known to have excellent management personnel. And like any other quality company, it has made marketing or production mistakes from time to time through the years. The announcement that they made that knocked the price down, whether it was an earnings warning, shutting down a product line, or whatever, the factors that were announced as the result of the problem did not surprise company management. They knew that there were problems well before the news announcement. Being intelligent business people, the management of IBM was aware of the problems and had been working on the solutions months before they had to announce.
When the announcement was made, probably many strides had already been taken to correct whatever problems caused the price to drop. For the long term investor, it would not be unusual to see the price of IBM move back up to at least the level from where it last gapped down, at approximately $100. This still provides a 15% return.
You can chart your own course through common sense technical analysis of stocks. Watching for a Candlestick “buy” signal gives you the edge. IBM is not going out of business. Who was buying at these levels when everybody was selling? The smart money! Are the professional analysts of Wall Street recommending to buy at these levels? Probably not! But watch the price move from $85.00 back up to $95.00, then you will see the brave million dollar analysts say it is time to buy. Practical hands-on analysis, being able to see the “buy” signals for yourself, will keep you ahead of the crowd.
Speak Your Mind