The technical analysis of stocks is the method used by stock traders to evaluate securities through the analyzing of statistics generated by the stock market activity. The intrinsic value of a stock is not important to technical analysts but rather the patterns identifiable on stock charts are what are important. These patterns are important because they signify future activity of stocks. Technical analysis can include identifying chart patterns on stocks charts, or the use of technical indicators, and oscillators. In fact, many use a combination of both of these methods.
The study of stock technical analysis is based on three assumptions. These three assumptions include first, the fact that the market discounts everything. Second, stock price moves in trends, and third, history tends to repeat itself.
When we say that the market discounts everything, this means that the price of a companies stock reflects every possible thing that has ever or could affect that company. Fundamental analysis factors are included in this assumption, but not used when stock trading. They believe that a company’s fundamentals will be reflected in the pricing of that stock so they choose only to study the analysis of price movement.
The second assumption of the technical analysis of stocks is the assumption that price moves in trends. Price movements are believed to follow trends so this means that after a trend has been established, the future price movement is likely to follow the same direction as the trend than to be against it. Most technical analysis trading strategies are based on this assumption.
The third assumption made by technical analysts is the fact that history repeats itself. Many stock charts have been in use and continue to be in use for over 100 years. This gives credibility to this method of trading because price movements have proven to be repetitive in nature. What is interesting about this assumption is what it says about market psychology. Basically, it shows that individuals who participate in trading the stock market tend to react consistently to similar or recurring market stimuli.
The technical analysis of stocks is interesting because traders don’t care if a stock is undervalued. Technical analysts only care about past trading data and where the security might move in the future. This is one of the reasons that so many fundamental analysts view this type of analysis in a negative light.
Technical analysis is a very interesting and effective method used by many of the word’s top stock traders. There is so much to learn about this type of analysis and so many variations that fall under it as well. Continue to learn about fundamental and technical analysis and determine what works for you.
Market Direction
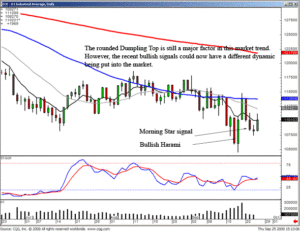
If you look at a chart of the Dow for the last three months, you can logically deduce that you would not have wanted to try to trade this type of market. It is absolutely sideways and it can be seen that candlestick formations did not produce any consistent trends. A bullish candle one day, a bearish candle the next day. That is what is clearly represented utilizing candlestick formations. How does this information benefit anybody when looking in hindsight? Price trends have consistent natures. After an extended indecisive trading period, what is usually expected? This answer is clearly illustrated when you see a flat series of Doji’s. Doji’s represent indecision. A series of Doji’s represent more indecision. However, there is a definite characteristic that can be found after investor sentiment has shown indecision. The next price move, whether bullish or bearish, will show excess strength.
Knowing that information, simple analysis allows for a high degree of accuracy for projecting which direction that trend may move. As mentioned in previous newsletters, the last three months of trading have produced a Dumpling Top. This could be the prelude to a severe selloff. Investor sentiment is based upon the analysis of existing information/circumstances. Was the Dumpling Top the accumulative analysis, by the major research departments, that a financial crisis might be in the making? Could be, but because most of us do not have large research departments at our beck and call, analyzing the candlestick pattern becomes our tool. The fear, that sold the market off two weeks ago, was modified with the announcement of a potential bailout situation. Now that the bailout program seems to have been worked out, candlestick signals should produce a clear evaluation of what the market sentiment is doing currently.
As seen in the Dow chart, the big bullish Harami indicated the selling had stopped. The confirmation day moved right to the 50 day moving average. The next day made it obvious the 50 day moving average had acted as resistance the first time it was approached. But note what type of signal formation as been produced over the past three days. A Morning Star signal at the tee line. What happens when a major moving average is approached the first time and fails? It will usually have a pullback and then may test that level again. The fact that a Morning star signal has occurred at the tee line and stochastics are still in a slow upward direction provides some evidence that the 50 day moving average will be tested again. Usually the second test will breakthrough.

DOW
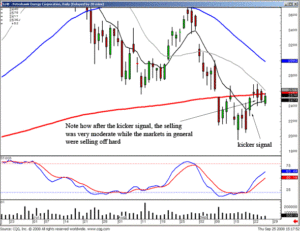
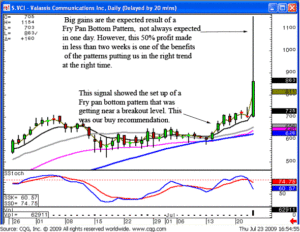
The power conveyed by bullish signals not only reveal the direction of a price move but they have an added feature. A strong bullish signal indicates the Bulls are taking control. The stronger the signal is, the better the trend can be evaluated even when the market is selling off dramatically. The intrinsic force built into the signals usually result in, at worst, a moderate pullback when the market is selling off. As illustrated in the Petrohawk En ergy Corp. chart, the Kicker signal indicated excessively strong bullish sentiment. The following three days, when the markets were selling off severely, the price of HK held up reasonably well. The same result as illustrated in the VCI chart. A major advantage of candlestick analysis is seeing where the buying strength is coming into a trend and identifying the trend has not reversed when the markets in general are selling off hard. This produces the opportunity to take advantage of the next move once the markets reverse their downward move and start moving back up. Obviously, this is not rocket science. This is merely being able to interpret the relative strength of a price move based upon its reaction to general market moves after a candlestick buy signal has been identified.

HK

VCI
The past three months have been relatively boring as far as investments have been concerned. Is the mortgage bailout situation good for the markets or bad for the markets? Each one of us may have our own opinion. But that opinion does not mean a hill of beans. It is the general consensus of the whole investment community that is the important factor. The candlestick signals will make it visually clear as to how the majority of investors have assessed what the mortgage bailout will do for the economy. Let the market tell you what the market is doing.
Free Chat session tonight at 8 PM ET – What can we expect from the results of today’s decisions? Click here for instructions.
Good investing,
The Candlestick Forum Team

This Week’s Special – 50% OFF!!
Scanning Techniques to Higher Profits!
Once taught only to Steve’s private clients; Now available on CD.
Website special reflects current newsletter. If you are reading an archived newsletter you will be directed to Current Website Special.
Speak Your Mind