Technical commodity analysis goes back to the days of rice traders in 17th century Japan with Candlestick basics. Candlestick trading tactics date back to rice trading in the days of the Samurai. Today’s technical analysis of commodities may be faster when aided by online trading software but its roots are very old and tested by time. While fundamental analysis of commodity trading looks to reported events, numbers, economics and the like technical analysis of commodities derives from the Candlestick trading adage that the market itself will tell you what the market will do next. Technical commodities trading looks at commodity prices and price patterns, commodity market volume and changes in volume, and measures of commodity market volatility as technical indicators of the directions that commodities markets will next take. For those beginning commodity futures trading Options and Futures Training will give you a head start in understanding how technical commodity analysis can help you make a consistent profit in a commodities exchange.
Commodity Prices
Commodity price is the most important part of trading commodities. The commodity price is what traders buy and sell at and the difference minus commissions and fees is the trader’s profit. Everything else in technical commodity analysis is meant to help predict commodity prices. Technical analysis charts are fundamental to following and predicting commodity prices. Traders use Candlestick chart formations and their modern equivalents to predict commodity market reversals and continuation of market trends. Understanding support and resistance zones, for example, is typically much easier when looking at commodity price charts rather than columns of figures. Adding a moving average to a chart of commodity prices will make it much easier to see market direction.
Commodity Market Volume
Trading volume in commodities is important because a high trading volume gives the commodities market liquidity, making it easier to buy and sell in smaller price increments. High volume also tends to cause temporary market inefficiency as traders try to catch up with changes in market fundamentals or new technical indicators. The tuned in trader will make much of his or her profit during periods of high volume. The wise trader also knows that high trading volume often precedes a change in commodity market direction. He or she will use technical commodity analysis indicators such as the demand index in evaluating price and volume to know when a change in a commodity price trend will take place.
Commodity Market Volatility
Market volatility, like market volume, can be profitable for the commodity trader. Market volatility, like volume, increases market inefficiency, allowing the tuned in trader to make profits commodity trading online. Volatility comes with new market news and market indecision. High volatility with large differences between market highs and lows is often an indicator of a coming drop in commodity price while a narrowing trading channel if often an indicator of solidifying market sentiment and either a stable price or the start of an upward trend. The Swing Index is often used in technical commodity analysis to indicate the actual direction of the market during periods of high volatility by comparing opening, closing, high, and low commodity prices on the trading day and the previous day. As we mentioned above, Commodity and Futures Training is a great way to begin commodity training and a great refresher for the seasoned trader. May you do your homework and trade successfully.
Market Direction
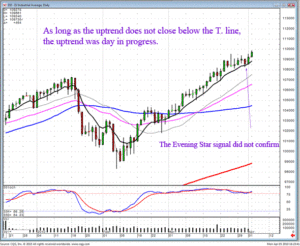
The question was asked in Denver this weekend, how do you make big profits in a slow uptrending market? The answer is very simple. What does a slow uptrending market reveal about investor sentiment? It shows there is not any significant change of investor sentiment. This may sound like an obvious statement, however it has significant ramifications. When do Candlestick patterns work most effectively? When investor sentiment has a chance to develop into exuberant price moves. The longer a trend moves consistently in one direction, investors sentiment becomes more pronounced on an exponential basis. At some point, the general masses will finally become confident and start rushing back into the market. Unfortunately, that is usually an indication that a top is forming.

DOW
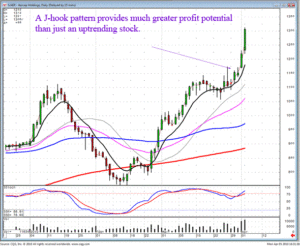
Having an understanding of the patterns that work most effectively allows investors to take advantage of big profit moves during a slow uptrend. The two primary patterns that are working most effectively right now are the Fry pan bottom breakouts and the J-hook patterns. Big price moves can be expected if the market direction does not change coming out of these patterns. There is not anything highly sophisticated about the analysis of candlestick patterns. They are the reoccurring visual depiction of how in investor sentiment operates. The J-hook pattern is formed by an initial strong price move. Something has occurred to make investor sentiment very bullish about getting into that trading entity. However, strong price moves bring about profit-taking. The advantage candlestick signals provides is the ability to analyze whether a pullback is profit-taking or a full-scale reversal. Identifying the signals that would indicate merely profit-taking permits a candlestick investor to reenter the trade and participate in the next profit move.

AER
Once again, we show our recent recommendation of AER. There are numerous stocks that have come up on our scans showing strong J- hook patterns. Even when the first portion of the price move may have been missed, the candlestick investor can take advantage of the next price move. This comes about by recognizing where the low risk entry point would be as well as a possible first resistance level.
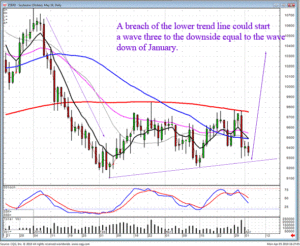
Using candlestick signals and patterns allows for the preparation of potentially big price moves in either stocks or commodities. The analysis of soybean prices becomes airy simple when applying candlestick signals and moving averages. Note how the May Soybean chart shows a consolidation stage that had one consistent factor. The 200 day moving average clearly acted as a resistance level. The sideways trend channel clearly reveals the lack of bullish force to get above the 200 day moving average. This could lead to a failure of the lower trend channel. If that occurs, another strong down move, such as the one seen in January, could occur again. This makes placing short positions a high probability/high profit potential trade. Will that always occur? Not always, but the reoccurring results of investor sentiment makes the identification of candlestick signals at important technical levels a highly profitable activity.

May Soybeans
Commodity trades have certain advantages over stock trades. Less outside influences allows a commodity trade to move in a trend direction with much more consistency been filed in a stock trade. Although commodity trading is highly leveraged, utilizing the information found in candlestick signals dramatically improves the risk/reward factor. It is very important to not only recognize and understand the high probability trade situations in commodities, is also very important to understand and control your own emotions. If you can control your own emotions while trading commodities, which are fast-moving highly leveraged trading entities, you then will have a very firm grasp on how to manage your stock positions.
Chat session tonight at 8 PM ET.
Good Investing,
The Candlestick Forum Team
Scanning Techniques to Higher Profits – On Sale at 50% Off regular price!
Website special reflects current newsletter. If you are reading an archived newsletter you will be directed to Current Website Special.
Speak Your Mind