Trading tactics can make the difference between success and failure in trading stocks, commodities and Forex. Whether you are trading directly or trading options or futures, good trading tactics can increase your profit and bad trading tactics can lead to substantial losses. Simple and effective trading tactics include always setting your trading stops when you are trading online. Likewise for short term trading and short term investing using trading limits is wise. Always work to understand the basic fundamentals of each stock or commodity in which you invest or trade. Much of fundamental analysis gets incorporated into stock price and commodity price as soon as it is known so we might think fundamentals are not important. However, knowing the fundamentals of a stock gives us a clear idea of the limits of stock price for it is, in the end, the fundamentals that govern stock prices. Always, always, always follow price patterns with technical analysis tools such as Candlestick pattern formations.
Because Candlestick analysis signals are clear and easy to read they tend to reduce the possibility of misunderstanding. This is, unfortunately, too often the case with how technical analysis results are displayed. The results and predictions with other technical analysis tools may well be the same as those of Candlestick analysis. However, Candlestick analysis distills all of the information into easy to read Candlestick signals allowing traders to proceed to the business of stock trading or commodity trading while others are still puzzling over just what their online trading software is trying to tell them.
General trading tactics include buying on the rumor and selling on the news. A more accurate description of how this works is that the trader sees an emerging pattern in his Candlestick stock charts. He may have been alerted to this stock by reading the stock market news. But, it is by careful examination of stock prices and their patterns that the trader using Candlesticks sets up his trade. He will buy stock, sell stock, sell short, or buy or execute options contracts when the time is right according to Candlestick chart analysis. He will then check the stock market news to confirm that a piece of news has hit the streets causing everyone else to enter the trade, often too late for good profits.
When you are in a losing position, don’t keeping adding money to the trade. This is better put in a very old saying, “Don’t throw good money after bad.” This is a matter of discipline. Trading is not gambling. We use solid tools such as Candlestick patterns in order to guide our investing and trading decisions. Letting the psychology of trading take over in a moment of difficulty is letting the twin demons of greed and fear run the show. They virtually never make you a profit and can often leave you bankrupt! The best of trading tactics is to follow your Candlestick signals, trust them, and act on them.
In regard to acting on Candlestick chart analysis there are times when not to trade. The beauty of Candlestick signals is in their clarity. Trying to force trades is one of the bad trading tactics that deplete your margin account. Sometimes the best of trading tactics is not to trade at all. Satchel Page, the famous 20th century baseball pitcher once said that if he just held on to the ball the batter could not hit it. Likewise, not forcing bad trades keeps the market demons away and saves you money. Use your Candlesticks, trust them, and when they say not to trade, don’t!
Market Direction
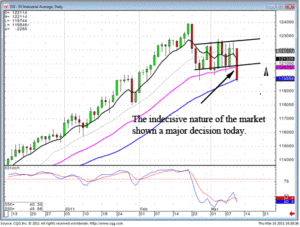
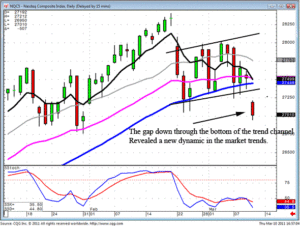
Was there a way to take advantage of the big gap-down selling today? Not really! The nature of the market trading for the past few weeks has been very schizophrenic, up big one day and down big two days later. Both the Dow and the NASDAQ opened to the downside very quickly today. Most stocks gapped down, not giving the opportunity to short them. Was candlestick analysis a benefit to investors in predicting a gap down? No, but candlestick analysis should have had the portfolio positioned correctly.
For the past two weeks, the wild fluctuations in the markets have revealed the Bulls and the Bears did not have control of the market direction. When there is no evidence of a viable trend, this has obvious consequences for an investor. The major benefit of candlestick analysis is that it allows an investor to evaluate a direction of a price/trend with reasonably accurate results. The purpose of investing is to put funds to work with the probabilities being in your favor. When the market conditions demonstrate there is no beneficial probabilities, the investor has investment decisions that can be made from that information.

DOW

NASDAQ
As the Dow chart and the NASDAQ chart reveals, a sideways trend channel had been in progress for the past two or three weeks. These conditions did not produce any favorable probabilities for either to be long or short. In most cases, the proper investment strategy would have been to sit on the sidelines until a trend direction could be detected. This is the logical strategy for the majority of traders. However, candlestick analysis provides one more opportunity. It allows an investor to pinpoint the few stocks that are showing good strength and the few stocks that are showing great weakness. This allows for a portfolio mixed with long and short positions that will benefit from the sideways market.
There will always be opportunities to make money in all market conditions. The simplicity of candlestick scans allows for identifying the positions that are moving, even with the market in a relatively flat mode. Take advantage of the information built into the signals and patterns. This information will allow for highly accurate trend of valuation and the ability to make profits when others are sitting on the sidelines. Candlestick analysis provides a trading platform consisting of reoccurring price movements based upon investor sentiment.
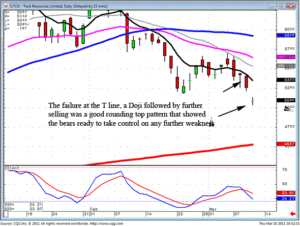
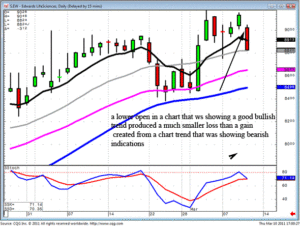
Understanding the psychology that is built into the signals is a major factor for understanding why prices move as they do. Recognizing pattern setups allows an investor to take advantage of big price moves prior to their movement. As illustrated in the TCK chart, the slow curve showing failure at the T-line was an indication the bears were starting to take control. These are trading areas that can be executed prior to a major move to the downside. The inherent pressures of price movements makes it feasible to take advantage of prices going in the direction of the market indexes while also being positioned in trades that were anticipating the opposite direction. Those trades, although producing small losses when the market moves big in one direction, would be much more than offset by the positions that were oriented toward the actual market move.

TCK

EW
Chat session tonight at 8 PM ET.
The new book – Candlestick Profits, Eliminating Emotions with Candlestick Analysis, is in delivery from the printers. They should be in Houston on Tuesday, March 15. If you have not yet ordered your book, please do so this week. Once the books are sent out, you will have lost the opportunity of finding that crisp $100 Bill to be placed in one of the premarket release books. Hurry to order the new book Candlestick Profits – Eliminating Emotions with Candlestick Analysis before the special end!
Good Investing,
The Candlestick Forum Team
Speak Your Mind