Archives for November 2019

Stock Investing Basics of Japanese Candlesticks

Candlestick trading analysis does not require knowing intricate formulas or ratios. Candlestick analysis does not require massive amounts of education to effectively utilize the signals. The stock investing basics of Japanese Candlesticks result in clear and easy to identify patterns that demonstrate highly accurate turns in investor sentiment. The average investor does not have to be dependent on the investment professional, a professional whose recommendation does not always have your interest at the forefront. Whether totally unfamiliar with investment concepts or very sophisticated in investment experience, the Japanese Candlestick trading formations are easily utilized. The signals and patterns are easy to see. Candlestick Profits - Bar Chart ComparisionAs illustrated, a stock price closing higher than where it opened will produce a white candle. A stock price closing lower than where it opened creates a black candle. The boxes formed are called “the body”. The extremes of the daily price movement, represented by lines extending from the body, are called “shadows or tails.”
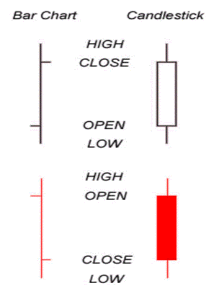
A stock price closing where it opened or very close to where it opened is called a ‘doji.”

A hollow candle forms when the stock closes higher than its opening price.

A solid (or filled) candle forms when the stock closes lower than its opening price.

Memorizing the Japanese Candlesticks names and descriptions of the candlestick trading formations is not necessary for successful trading. Reading about the Japanese Candlesticks signals is interesting and it aids in remembering them.

The Candlestick Forum is the foremost aid in learning how to use the Japanese Candlestick trading signals correctly. Stephen W. Bigalow has studied, analyzed and developed simple methods for profiting from the signals. His published book, PROFITABLE CANDLESTICK TRADING: PINPOINTING MARKET OPPORTUNITIES TO MAXIMIZE PROFITS, incorporates the common sense, logical disciplines that most investors are aware of but ignore.

For more information on the book that will revolutionize your investment perceptions: Profitable Candlestick Trading: Pinpointing Market Opportunities to Maximize Profits and “High Profit Candlestick Patterns: Turning Investor Sentiment into Profits” released December 2005.

Throughout history, investors have acted in the same manner through all market conditions. Investment behavior is a function of the market conditions. The Candlestick Forum helps investors recognize those market conditions, explains how human weakness creates those conditions and instructs the investor to take command of those weaknesses. The Japanese viewed patterns developing over a number of centuries. The patterns produced predictable results. Learning the patterns is a simple process. Utilizing the underlying knowledge built into the signal formation provides an immense advantage for amassing wealth.

You now have the forum to learn how to direct your own investment results. This website is established for the continuation of the learning process. Any services that you utilize from The Candlestick Forum’s expertise can always be confirmed and reinforced through constant contact with the Candlestick Forum’s staff.

Becoming proficient at any trading method requires constant exposure to training and practice. The Candlestick Forum staff acts as a constant source of signal analysis confirmation as well as an educational taskmaster to keep subscribers alert to highly profitable trade situations.

Learn the intricacies that make the signals so powerfully effective. The Candlestick Forum’s library of E-books provide detailed insights into mastering the Candlestick methodology in-depth. Over a decade of learning procedures have been developed into a fast and easy method for becoming profitably proficient. Discover the potency a price move produces when knowing the psychology behind a reversal formation. Cultivate inordinate profits from a portfolio by exercising simple stop-loss methods made obvious by the Candlestick formations.
Discover the knowledge filled e-books that describe how to make huge profits from candlestick signals.

The magnitude of your profit potential is limited only to the level of leverage you want to partake. The Candlestick Forum’s e-books provide clear descriptions of how to use options, futures, commodities and margin in conjunction with reversal patterns. Consistent use of high probability trades can produce massive returns. The compounding effect of well designed, high profit potential trading programs turn singles into home run returns. Become educated in trading practices that eliminate destructive emotional intervention.

Take advantage of the benefits that Japanese Candlestick trading provides. Opportunities are easily identified, Somebody will take advantage of the information the signals provide. Once you learn the valuable benefits revealed by Candlestick formations, the rewards will be overwhelming.

Candlestick Images and Explanations

The Added Power of Candlestick Formations

Training Tutorial

Candlestickforum Flash Cards  These unique Flash Cards will allow you to be “trading like the Pro’s” in no time.
 

Forex Software

Thanks to computers and the Internet, the trading world will never be the same. Software that has allowed for online stock market trading is now available in the commodity world and trading with Forex software has become an excellent way to trade futures. This software was designed to meet the user’s needs in several key areas. To be truly valuable, the Forex software needs to have:

  • Instant Rate Availability – The Forex software for currency trading must be able to provide instant access to valuable rate information. Due to its high level of volatility, Forex news changes fast. If it takes minutes to get a quote, everything could have already changed by the time it is received. This isn’t the case; once this rate information is received, it is possible to trade at that price. Only real-time quotes allow that kind of instantaneous exchange.
  • A High Level of Security – Like any other financial transaction that you perform over the Internet, security of your data is the main concern; this fact can be even more critical with your Forex software since the amount of money involved in your transactions can be very high. Successful Forex traders not only want to implement their trades, but they want to do it with the highest security. The majority of Forex software systems use at least one layer of 64-bit SSL encryption in addition to extensive procedures for data backup and recovery methods.
  • Anytime Access – Commodity trading has become a 24-hour a day, 365 days a year activity. Forex trading software is available around the clock, providing updated quotes and allowing traders to initiate trades at any time during the week.

Forex Software Platforms

This is the classic discussion with any kind of software solution and Forex software isn’t any different. Forex currency trading for beginners on this type of software is the same no matter which method is used. The decision to provide service as a client-side, or downloaded, software versus web-based software is individual to each company but each will face the same main points.

    • You have more control over your data. Commodities trading with this method not only places the software on your computer, but all of your records as well. In other words, your history of futures trades will be kept on your computer and not in the manufacturer’s database.
    • Access to the markets does not depend on using a portal with the software provider. You can still access the futures markets even if the Forex software manufacturer’s website is down.Client-based Forex – This software solution means that the actual online futures trading software is located on your computer and access to the markets requires only an Internet connection, not an account on the Forex software creator’s website. The advantages of this approach are:
  • Web-based Forex – This approach means that all of the operations are performed on the creator’s website and that website needs to be accessed for all operations.  The beginner investing with a system will find advantages such as:

    • Everything you need is located on the servers of the software creator.  You don’t have to do backups or worry if you downloaded the latest version of software.
    • If you have access to the Internet you can use the software, no matter where you are.  With this software application, you do not have to be at your own computer for trading Forex.

Today’s standard

Most software companies use web-based systems for their Forex software; freedom to access their account for trading commodities from anywhere in the world, controlled backups of data and transactions and world-class security for personal information make this the solution that is most commonly used.

Conclusion

Forex software has opened the markets to everyone. Offering research materials, current news and secure trading and investing Forex software is an excellent improvement in currency trading. 

Option Trading Education Combined with Candlestick Signals – A High Power Duo!

Option trading education becomes a much easier process when utilizing candlestick analysis. Option trading education usually involves ‘implementation’ for option trades. Many investors want to obtain an option trading education as part of their investment strategy. Unfortunately, an option trading education without knowledge of the direction (or the non-direction) of the underlying trading entities is worthless. Candlestick analysis becomes the focal point for directional analysis. Once an investor learns how to use candlestick signals and trading patterns successfully, then they can add the strategies developed through their option trading education.

An investor should not make the mistake of emphasizing option trading as their primary profit strategy. Establishing an option trade should be one of the investment methods for exploiting  price moves, after the candlestick analysis has been completed. Many investors try to find a trade that will fit the option strategy that they are trying to implement. The correct option trading education is learning the different option trading strategies so that it can be applied appropriately to fit the analyzed trade.

Candlestick analysis revealed that the markets were going to sell off over the past week. This became a very simple analysis when understanding what the signals were revealing. An Evening Star signal, right at a major moving average, becomes a strong sell signal, as we witnessed in the Dow this past week. The indication of the failure of the 50 day moving average now becomes a potential bearish pattern. Utilizing this knowledge allows investors to better analyze market direction. The same patterns in individual stocks produce the same information. And, that information is reinforced with the knowledge that the market in general should be getting weaker. Shorting those positions is one strategy. Buying puts would be another strategy. Buying puts and selling calls would be yet another strategy. The candlestick signals provide the clear  analysis of when to buy and when to be sell. Your option trading education should be learning the different strategies to take advantage of price direction. The Candlestick Forum highly recommends the teaching methods of Options University. Knowing which direction a price is going to move and the knowledge to apply the best option strategy for exploiting that move (while minimizing your risk) makes for a very powerful profitable combination. 

(We have received numerous requests for information on option trading..  Be on the look out….. within the next few days I will be sending you information for a ‘pilot’ program I have been urging my friend, Ron Ianneri, to put together. I know you will be pleasantly surprised.)

Market direction

The Blue Ice Failure pattern, as described by Dave Elliott of WallStreetteachers.com, reveals that when prices fail to come up through a moving average that it just came down through, the next leg of that price move is down to the previous lows or the next major moving average, the 200-day moving average. As seen in Thursday’s trading, the Dow went down through the 200-day moving average and formed a hammer/doji signal. Stochastics are in the oversold area. Is this the bottom? Probably, or there could be some junkie trading at these levels. Click here for more trading patterns and technical analysis products.

Members Only – Live Trading Room

Why trade alone when you can chat with fellow traders AND Stepehn Bigalow LIVE? See, hear and discuss everything from individual stocks, breaking market news, new trading techniques and hot stocks on the move.

Join this fast growing community of active traders. Each day members exchange ideas, share hot stock picks, new trading strategies and enjoy the comradery of fellow traders. Your questions are always welcome in this interactive trading community.

Doesn’t it get a bit boring, trading in front of the computer all day?

Join the Candlestick Chat Community.

Exchange ideas!  Share hot stock moves!  Accelerate your learning process!

Wouldn’t you like to get explanations and recommendations when viewing Candlestick chart patterns?


View a sneak peek of the Member Trading Room

Stock Splits – Getting More For Your Money

From time to time, companies will want to change the amount of shares available in their company or the price of their stock. The typical way of doing this involves stock splits and it is very successful in accomplishing the desired objectives. The stock market news has grown very accustomed to this phenomenon and while there is usually some initial excitement over a stock split, the end result is generally very smooth. We will discuss several of the reasons for stock splits and what effect they have on the stock market.

Different types of stock splits can have different effects on Wall Street news based on the reasons they are implemented. Several of the concepts to understand about this technique are literal stock splits, reverse stock splits and dividend payouts.

Literal Stock Splits

Because of the existence of reverse splits, it is necessary to differentiate between the two. For example, a literal stock split occurs when a company announces that it will do a 2-for-1 split of their common stock. If MEW Industries has 1,000 shares of public stock at $50 per share before a 2:1 split, they will have 2,000 shares of public stock at $25 per share after. The stock market average returns for these new shares will reflect the ratio that was used in the split.

There is one primary reason for this stock market strategy, which is to increase liquidity of the stock. Although there are investors buying Google stock at over $500 per share, many more investors would be inclined to buy if there were five times more shares at $100 per share. This tactic is employed by companies if their stock sales stall as the price rises. If the stock doesn’t stall companies will typically allow the price to rise, as indicated by Google over $500 per share and Berkshire Hathaway, the market’s all-time stock price leader at over $110,000 per share.

Reverse Splits

Reverse stock splits are less common and have a somewhat negative investment strategy attached to them. If the price of a stock drops too low, many mutual funds will not purchase them and they even run the risk of being delisted, or removed from the market indexes. In addition, the low stock prices create a psychological stigma as people view them as worthless. By doing a reverse stock split, companies can raise the stock price by lowering the number of outstanding shares, eliminating the problems caused by the low stock prices.

Dividends

Sometimes a company will choose to avoid a stock split and lower the share prices by paying a stock dividend to shareholders. The effect of this move is somewhat the same as a split in that it lowers the share price since the company is worth less after the payout. This can be a good investment philosophy for companies that already have a large number of available shares plus the move is usually well received by stockholders, since this is basically investing a portion of the profits back into the people that have already invested in the company.

Conclusion

Stock splits have historically been used by companies to increase or lower the number of outstanding shares or to change negative impressions of the stock price. Investment timing in companies like these has shown to be more psychological than factual since stock prices are adjusted and the resulting price movements follow. Stock splits are another interesting feature of investing and a good piece of knowledge for those who are learning about the stock market.

Stock Market Results Enhanced with Candlestick Signals

Stock market results require a proven trading system. Whether day-trading or long-term investing candlestick signals dramatically enhance an investor’s capability to recognize reversals. Most stock market results are based upon a mixture of investment decisions. Some investors will buy every hot stock tip that they hear. Some investors will only invest in stocks that are above specific moving averages. The best stock market results occur when an investor has a well disciplined investment strategy. Candlestick signals provide an extremely high probability format for identifying the best possible investment situations.

Stock market results should be based upon an investment strategy that is going to maximize an investor’s return. This may be overstating the obvious, but most investors confuse having an investment strategy with producing positive results. Fundamental research looks to identify stocks/sectors that have great potential for the future. The risk factor for long-term fundamental analysis is that many factors can come into the market before any expected result can occur in a stock price. Today’s fundamental research, which expects specific stock market results, may be influenced by other market factors that cannot be projected at the time of the initial analysis. World events or improvements in competitor’s products can greatly affect the long-term outcome of a stock price.

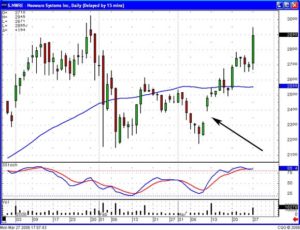
Candlestick signals provide an expected set of results. These stock market results are based upon centuries of analysis of what investor sentiment does to price movement. A candlestick buy signal in an oversold condition creates a high probability of a bullish trade. A candlestick sell signal in an overbought condition creates a high probability of a downtrend starting. Stock market results can be greatly refined when understanding what the candlestick signals are conveying. High profit trades can be much better analyzed when knowing what previous signal patterns have produced. As illustrated in the Neoware chart, the position was recommended when a bullish engulfing signal occurred in the oversold condition followed by a gap up the next day. The fact that investors wanted to come into this position with exuberant buying after a candlestick buy signal in oversold condition reveals that a strong uptrend was now in the making.

Stock Market Results Enhanced, NWRE

NWRE

The Bullish Engulfing signal illustrates a reversal in investor sentiment. A gap up after that reversal represents that the new investor sentiment involves very strong buying demand. This combination has a high probability of producing strong profits. The gap up from a bullish candle reveals very strong buying. Utilizing candlestick signals followed by gap ups can make a very good living for the astute candlestick investor. This is not a difficult concept. Where do you want to have your funds invested? Where the buyers are buying aggressively! The candlestick forum provides some excellent training CDs utilizing candlestick signals followed by gaps. Most investors do not want to buy a stock that is already up 10%, 15%, 20% on the day. However, a candlestick investor, knowing what the gaps mean after a candlestick signal can participate in price moves that may still have a 100%, 200%, or greater move left in it after the gap up.