Stock Market Trading Tools – Candlestick Signals

Stock market trading tools should have one primary function.  Stock market trading tools should be easy to analyze, evaluate, and improve. Many stock market trading tools have come and gone.  Some work for specific conditions of the markets, others work for only stock market trading. Candlestick signals have been around for centuries.  The benefit of these trading tools is numerous.  They can be used for any trading entity that involves investor sentiment.  This includes stocks, commodities, futures, Forex, bonds or tulip bulbs.

The major advantage of candlestick patterns as a trading tool is that they have been proven to work effectively for centuries. The information incorporated into the signals can be readily applied to enhance emerging trading tools. Extracting profits from a stock market consistently becomes much easier when applying candlestick signals with common trading patterns. Investor psychology moves prices in waves. This has been occurring ever since the beginning of mankind. Applying candlestick signals to reoccurring trading patterns become a very high probability trading platform.

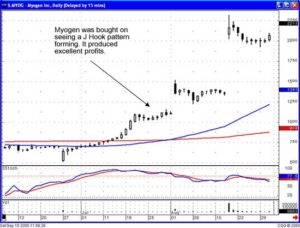
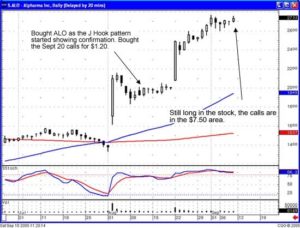
As illustrated and Steve Bigalow’s new book, “High Profit Candlestick Patterns” a Jay-hook pattern produces extremely good profits. It is an easy pattern to recognize and using the candlestick signals as trading tools, the investor can identify many potential patterns in their early stages of development.  This allows the investor to maximize profit potential while at the same time reducing losses with simple stop loss procedures.

J-hook

J-Hook Pattern

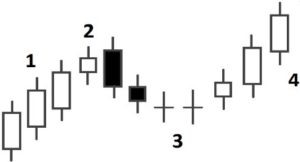
A Jay-hook pattern is a variation of a wave 1 — 2 — 3 pattern.  It becomes an easy pattern to identify with the use of candlestick signals.  The problem most investors have is understanding when to sell after a price has made a strong move.  The Jay-hook pattern demonstrates some easily identifiable attributes.  First, it starts with a strong uptrend, a trend that usually produces “stronger than normal” returns in a very short period of time.  This strong up-move is significant enough to create the normal wave pattern. A reversal caused by profit taking, followed by a declining the trajectory of the pullback, then the continuation of the uptrend.  The Jay-hook pattern is the description of the pullback that starts to round out at a bottom and starts moving back up, thus forming a ‘hook.’

This pattern provides the candlestick investor with some very simple profitable applications.  The first uptrend will usually show clear candlestick ?sell? signals when it comes to an end.  The top may be formed with the stochastics in the overbought area or very close to the overbought area.  Because all the strong initial uptrend, the first evidence of ?sell? signals should be acknowledged.  Even if it is suspected that the uptrend could be forming a Jay-hook pattern, why a risk remaining in the trade?  When a sell signals become evident, take profits.

What criteria makes a candlestick investor suspect a Jay-hook pattern to form?  The analysis of the market trends in general should provide that information.  For example, if a stock price has had a strong run up while the market indexes have had a steady uptrend, and the market indexes do not appear to be ready for a significant pullback,  then a strong stock move could warrant some profit taking before the next move up.  The benefit of being able to identify candlestick signals is being prepared for the witnessing of some candlestick ?buy? signals after a few days of pullback.  These signals would also alter the trajectory of the stochastics that will be pulling back.
 
Opportunity is missed by most because it is dressed in overalls and looks like work. ? Thomas Alva Edison
 
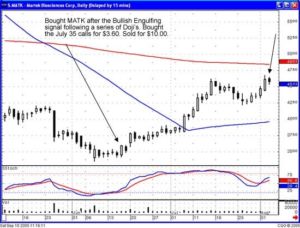
Witnessing Doji’s, Hammers, Inverted Hammers or Bullish Haramis, after a few days a pullback becomes an alert that the selling is starting to wane.  If the stochastics are flattening out during that same time frame, then a set-up for a Jay-hook pattern is taking place.  Taking profits when the first sell signals occurred in the initial uptrend eliminates the downside risk.  Those candlestick ?sell? signals indicate that it is time to get out of the trade.  Even though the strength of the initial move would warrant  suspecting  a Jay-hook pattern to form, there is no guarantee that the pullback couldn’t retrace 20%, 40%, 60% or even greater of the initial up-move.

This creates a trading strategy that allows for an investor to utilize the common sense built into the candlestick signals. When it is time to get out, get out!  If after four days, small candlestick buy signals start forming, there is nothing wrong with buying back into the position.  The second entry of this trade now has some targets that can be clearly defined.  The first target should be the test of the recent high.  Although this may not be a huge percentage return moving to that level, at least the probabilities indicate that it should be profitable.

The benefit of candlestick signals once again can be applied if and when that recent high is tested. Witnessing another sell signal, as the price approaches the recent high trading level, would be a clear indication that the recent high was going to act as resistance.  This would induce taking quick profits and getting back out of the trade.  On the other hand, if strong signals are seen as the recent high is breached, that would be a clear indication  the  high was not going to act as a resistance level. A new leg of the trend may be in progress.

Best Option Trading System Begins with Candlestick Analysis

What is the best option trading system? A system that can utilize price direction with a high degree of predictability. Most investors want to implement the best option trading system that they have learned. They want to apply their best option trading system with less emphasis on trying to find the best price movement of an underlying stock. The best option trading system is knowing a multiple number of options strategies. The candlestick signals provide the information needed for projecting the best price moves. Knowing a number of options strategies allows the investor to exploit the price move.

Options provide many benefits versus buying or shorting the stock outright. Because candlestick analysis incorporates the use of probabilities in its evaluation, that same thought process can be extrapolated into option strategies. The best option trading system is one that involves taking advantage of the upside potential while minimizing an investor’s risk exposure. These strategies can be applied with some simple common-sense evaluations. How much time is left until expiration? What has been the previous volatility of the underlying stock? What is the likely target for this price move based upon the potential pattern formation, resistance levels, and strength left in the stochastics? Analyzing this information with the evaluation of what the candlestick signals are revealing allows an investor to put the proper option trade in place.

Understanding  how to use candlestick signals and options strategies correctly expands the profit opportunities that most investors do not take advantage of. For example, a stock price that appears as if it could move from the $40 area to the $45 area in a specific time frame may have call options that do not provide a significant profit for the risk exposure. In this case, selling the puts may make much more sense. Alternatively, buying the 40 calls and selling the 45 calls might produce the optimal option trade. A spread reduces the amount of money exposed to the trade. It also increases the percent of profit that can be made in the trade. It does reduce the potential upside that could be made if the price movement is much greater than analyzed for the time remaining. However, the best option trading system should incorporate the same probability projection as the underlying stock position. What are the probabilities of the price moving to a certain level based upon the candlestick signals and the confirming indicators? That is the basis that the option trade should be made. Worrying about price movement opportunities that ‘could’ occur in a price move is where most option traders reduce their percentage returns dramatically. Utilize the signals to project the correct direction. Utilize the confirming indicators to decide which option trading strategy is the best for the analysis of that trade.

Option trading is just a spoke of the investment wheel. Learn how to use numerous options strategies successfully. This knowledge, combined with  candlestick analysis, becomes a powerful tool for extracting profits out of the markets.  Review Options Trading with Candlesticks in our Free Resources Category. Bullish – Bearish – Neutral – Breakout Option Trading Strategies.

 Market Direction

The large Hammer/Doji formation that appeared in all the indexes on Thursday was a ‘possible’ reversal signal. The Dow formed the signal as the prices came down through the 200 day moving average and then came back up and closed above it. However, the Hammer/Doji signal occurred in the NASDAQ, the S&P 500, and the Russell 2000. But in those indexes, stochastics had not yet gotten to the oversold condition.

Online Stock Trading Forum – The Candlestick Forum Summer Review

The summer of 2005 was a very profitable one. The ideas that were discussed in the Candlestick Forum’s online stock trading forum resulted in some big profits. The online stock trading forum has multiple benefits. First, it exposes investors to stock trading ideas that they may not have found themselves. Additionally, an online stock trading forum oriented toward a trading methodology, such as Candlestick signals, allows investors to get better insights on how that trading methodology operates.

Unlike last summer, the stock market was much more active this summer. This made the activity on an online stock trading forum much more relevant. The nature of the market this summer allowed investors to participate in some very profitable moves. “Let the markets tell you what the markets are going to do.” This is the primary function of Candlestick signals. The Japanese rice traders use the signals to analyze the direction of trends.
Candlestick formations allow a Candlestick investor to much more accurately evaluate the investor sentiment of a trend. As you may have noticed, the advice from the Candlestick Forum had been that although the overall trend in the beginning of the summer was not strongly bullish, it would be a slow uptrend. The call for late June was to take profits and go short. The call for early July was to go long. The call from late July to the end of August was that although a downtrend was going to be slow, there were too many stocks/sectors that were still acting strong. How did the Candlestick analysis project the trend so accurately? That will be a topic for discussion in an upcoming chat session.

The ability to analyze the directions on the market with relative accuracy allows the Candlestick investor to exploit the big profit potentials. Although most of the summer trading activity seemed relatively boring, the Candlestick signals were exemplary in one vital facet. They pinpointed the stocks that had the probability of profitable moves.
Although the markets have been relatively lethargic over the summer, the Candlestick signals identified some high profit potential trades. Not only will Candlestick signals identify profitable trades, the correct formations set-ups identify high-profit trades. Does this mean that every established position results in good profits? Definitely not! But it did create a trading program where many trades were slightly positive, flat, or slightly negative, maintaining the equity of the account. However, the inherent attributes of the Candlestick signals put us in positions that did result in a high profit situation. These results were nothing more than placing funds in what potentially was a high profit possibility. Being able to participate in an occasional high profit trade, especially in a flat trading market, helps increase the total monthly returns.

Online Stock Trading Forum 1

Online Stock Trading Forum 2

Online Stock Trading Forum 3

Online Stock Trading Forum 4

Online Stock Trading Forum 6

Online Stock Trading Forum 5

These are just a few examples of some of the big trade results from the Candlestick Forum picks during the summer. They are not being presented for any bragging purposes. The point that is trying to be demonstrated is that even when the markets were not all that wildly exciting, the Candlestick signals pinpointed some high profit trade potentials.

With the markets being in a slow steady downtrend, not all recommendations performed properly. However, just as the Candlestick signals illustrate when it is time to buy, they also illustrate when a trade is not working. That provides an excellent stop-loss management process. The vast majority of losing trades have minimal losses. If the signals do not confirm, they are closed out immediately. Those losses were well offset with numerous positions that worked moderately well, being up 3%, 5%, and 7%. The combination of the majority of positions produce a respectable positive return each month. What greatly enhances the returns is being able to participate in an occasional big profit position.

Bottom line, the point of this illustration is to educate investors of the fact that Candlestick signals will have an investor in large profit trades in an inordinate percentage of the time. “Let the markets tell you what the markets are going to do.” This summer the markets showed us that the majority of stocks would be trading relatively flat but that there would be pockets of stocks moving. The Candlestick signals easily identified those pockets.

Market Analysis Systems – Seeing The Market Move

If you only knew what the market was going to do before it did it, you would be rich by now. If a thought like that has run through your mind before, you are going to love this topic. It may seem like successful traders have the ability to see movement in the market before it happens. While there are no known psychic stock investors, it is possible to develop the ability to determine movements in the market before they occur and you won’t even have to use a crystal ball or bend spoons with your mind! All you need is to do your technical analysis and use the best market analysis system available.

What Is a Market Analysis System?

This sounds so good that if you don’t know, you are probably wondering what a market analysis system is. This is a method for tracking the market and looking for stock market trends, either of the entire market or of a particular stock. A market analysis system can be something simple like a bar chart or something more sophisticated like the Japanese Candlesticks. Both are market analysis systems but there are substantial differences between them and that difference can help you know what is happening in the stock market.

Bar Charts and Japanese Candlesticks

Bar charts, like Japanese Candlesticks charts, are a type of market analysis system. Bar charts consist of a series of ranges, the open and close for the market or a particular stock each day. By studying this data, an investor can try to determine a day’s event and when he or she analyzes the data for a week or month and tries to find trends. The problem with bar charts as a market analysis system is that there just isn’t much data provided and there is no underlying stock technical analysis provided. For example, if a stock closed yesterday at $5, opened today at $5, rose to $20 at mid-day, then fell to $6 at close, only the range between $5 and $6 would be reflected in your bar chart.

With candlestick analysis, the level of data provided is much higher. You still have open and close prices but you also have things like daily high, daily low and comparisons to previous close. If you use the example we mentioned for bar charts, you would have a body that reflected the difference between $5 and $6, a vertical line that extended up to $20 and the body color would represent the relationship of the opening price to the previous close. It is easy to see that this market analysis system provides much more stock market information than a simple bar chart.

Candlestick charts are the oldest type of price predicting charts, dating back to the 1700’s when they were used for predicting rice prices. In fact, during this era in Japan, Munehisa Homma became a legendary rice trader and gained a huge fortune using candlestick analysis. He is said to have executed over 100 consecutive winning trades! Candlestick charting still has a strong reputation as a market analysis system today. It is said to enable the investor to spot market trends three days before they occur.

Conclusion

A market analysis system is an important part of your stock trading plan. With a system like Japanese Candlesticks an investor has access to more data and the analysis abilities only Candlesticks provides. The strength of this system gives the investor the ability to see the market move without having to buy a crystal ball!

Successful Traders Use Successful Trading Techniques

What are the successful trading characteristics of today’s successful traders?

Some people are very comfortable doing stock analysis and some are not. And just because you feel confident and comfortable trading stocks, it doesn’t necessarily mean you will be good at it. There are no hard and fast rules on what makes a successful stock trader, yet there are several characteristics that those who make the most amount of money in the least amount of time all have in common.

1. To be successful, a trader must be patient. A successful trader let’s winning positions run, but is able to swallow his pride and close the trade when it isn’t working. Patience means knowing how to be resilient, courageous, and disciplined when the markets go against you.

2. The exploration of stocks is a key ingredient to becoming a successful trader. Developing skill in both fundamental and technical analysis is suggested.

3. The successful trader is passionate and has a biting desire to succeed. The biting desire to succeed can make all the difference in educating yourself about what you want to know and sticking to your strategy when the going gets rough.

4. As they practice stock trading, potential embarrassment is not a concern with successful traders. They expect to have losses and know when to cut them as soon as they are recognized.

5. Successful traders are highly disciplined. Extremely disciplined. A successful trader does what needs to be done, even if he isn’t in the mood. Discipline also means sticking to your strategy, not suddenly buying or selling on a whim, or because of a” hot tip”.

6. Successful traders know that mistakes are going to happen. They realize and appreciate that the ability to make their own mistakes is a necessary part of the learning process.

7. A winning trader knows the difference between defensive and offensive behavior, and when to use each – protect your money first, profit later.

8. Successful traders balance their lives. Stock trading can be addicting, a successful trader can break away ‘at will’ before putting too much at risk.

9. Successful traders are risk adverse. They don’t like losing money and control themselves before losing a large quantity, even if they have to admit they made a mistake.

10. Getting emotionally involved or placing trades based on hunches or rumors are not characteristics of successful traders. To be victorious you have to be able to resist the urge to prove you are right and be ready to make mistakes. Greed and fear should not affect your decisions. Setting stop losses on every trade is something that promotes success in trading. This means that on more than one occasion, you will have to admit that you are wrong.

By using stop loss strategies correctly, your ego and your portfolio will survive and you may be able to get back into your “pet” position again when trends tell you it is the appropriate time to do so. You will have to learn to disregard any emotional ties you have to your stock and make quick stock trends your master. Although you might miss the lowest entry points and the top selling points, you will be able to sleep at night and look at yourself in the mirror in the morning. Learning to get out of a stock position before your profits turn to losses becomes a necessity. Learn solid stock investing concepts.