What is the Strongest Candlestick Signal? The Kicker Signal!

What is the strongest candlestick signal? The Kicker signal! It demonstrates a severe change an investor sentiment. A good rule of thumb is that if an investor sees a Kicker signal, he/she should go long or short depending on whether it is a Bullish Kicker or a Bearish Kicker.

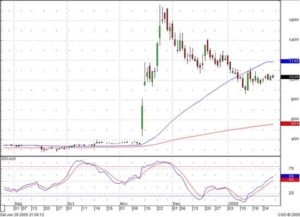
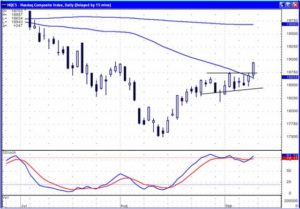
And that is exactly what we saw happen today in the NASDAQ index. The Bearish Kicker signal, especially with the stochastics in the overbought area, indicates that we want to be out of our long positions, either sitting in cash or shorting the market.

Kicker Signal

KICKER SIGNAL
( Keri Ashi )

Description

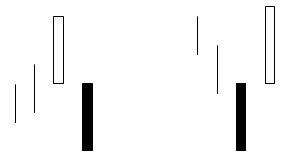
The Kicker signal is the most powerful signal of all. It works equally well in both directions. Its relevance is magnified when occurring in the overbought or oversold area. It is formed by two candles. The first candle opens and moves in the direction of the current trend. The second candle opens at the same open of the previous day, a gap open, and heads in the opposite direction of the previous day’s candle. The bodies of the candles are opposite colors. This formation is indicative of a dramatic change in investor sentiment. The candlesticks visually depict the magnitude of the change.

Criteria

  1. The first day’s open and the second day’s open are the same. The price movement is in opposite directions from the opening price.
  2. The trend has no relevance in a Kicker situation.
  3. The signal is usually formed by surprise news before or after market hours.
  4. The price never retraces into the previous day’s trading range.

Signal Enhancements

  1. The longer the candles, the more dramatic the price reversal.
  2. Opening from yesterday’s close to yesterday’s open already is a gap. However, gapping away from the previous day’s open further enhances the reversal.

Pattern Psychology

The Kicker signal demonstrates a dramatic change in the investor sentiment. Something has occurred to violently change the direction of the price. Usually a surprise news item is the cause of this type of move. The signal illustrates such a change in the current direction that the new direction will persist with strength for a good while.

There is one caveat to this signal. If the next day prices gap back the other way, liquidate the trade immediately. This does not happen very often, but when it does, get out immediately.

Successful Commodities Trading

Even the beginner can engage in successful commodities trading. Traders can make money in successful commodities trading by choosing commodities that they have an interest in and knowledge of. Commodities traders can use technical analysis tools such as Candlestick chart analysis to track and predict price changes in a given commodity. Successful commodities trading comes down to combining technical analysis with fundamental analysis. A good place to gain a firm knowledge of the fundamentals of commodities trading is with Commodity and Futures Training. Once traders have learned the fundamentals of trading commodities they will choose a commodity to trade such as oil futures or gold futures. Those with an agricultural background or interest may consider live cattle commodity trading or corn futures. Discipline, a trading strategy, and attention to detail will convert knowledge and commodity price patterns into profits for the hard working trader.

The list of commodities to trade is long. Corn, mini-corn, corn swaps, corn calendar spread options, distiller’s dried grain futures, wheat, mini-wheat, wheat swaps, wheat calendar spread, soybean, min—soybean, soybean swaps and so forth is how the Nymex list of commodities products starts. Metals traded include industrial metals such as copper futures and precious metals with some industrial use such as gold and platinum. Energy products include crude oil futures as well as natural gas futures, coal futures, and energy credits. For successful commodities trading it is important to have a strong working knowledge of ones own traded commodities. It is always important to remember that the biggest traders in the commodities markets include the producers, processors, and commercial and industrial buyers of commodities. These companies are hedging their investment risk in buying and selling commodities. Having only a passing knowledge of a commodity that you are trading puts you at a distinct disadvantage compared to someone with a background in the industry in question and decades of trading experience.

Despite the fact that traders are working in markets where the biggest players are experts it is absolutely possible to be successful in commodities trading. Part of why traders are successful is that they learn each commodity that they trade very well. They learn the Candlestick pattern formations in current trading and in the past. They follow the appropriate information sources to stay current on fundamentals. And, they get to choose which commodities to trade. A wheat trader working for a multinational grain company may work to hedge his company’s investment risk in grains but will likely not be trading gold futures, silver futures, platinum, or palladium. The wise trade will be knowledge across several commodities and will be able to trade where the action is or avoid markets that are so volatile as to be dangerous. Successful commodities trading can often come from trading the right commodities at the right time as much as from technical skill.

Anyone successful in commodities trading is always a student of the art of trading and a student of the commodities that he or she trades. A successful trader maintains a keen interest in just how a successful trade came about and how an unsuccessful trade happened. Experience leads to success and failure. Reviewing Candlestick chart formations, becoming a student of Commodity market history, and always working to improve a commodity trading system by review of produces results. Learning from experience leads to successful commodities trading.

Great Stock Market Trades Found in Breakout Patterns

A major advantage of Candlestick formations is that they can identify dramatic changes in investor sentiment. One of the highest profit potentials for making money on big stock market trades is being able to analyze the investor sentiment upon a stock “breakout” situation. Utilizing the candlestick patterns to interpret the results of a breakout situation provides a huge advantage to the Candlestick investor.

A breakout is almost self-explanatory. It is the dramatic movement of a stock market trade moving out of its normal trading area. It also has the element of a significant percentage increase in its normal daily trading range. This is usually accompanied by a massive increase in volume. A breakout is usually the result of an unexpected event or surprise result of a company’s operations. This can be affected by both internal as well as external factors. A prime example was Invision Technologies, the company that manufactures the luggage scanning machines at airports. 9/11 brought this company to the forefront. The huge move, an extremely large white candle in that stock price, far above its trading range for the prior six months, immediately revealed a definite change of investor sentiment towards this company. Breakouts, revealed using Candlestick analysis, immediately identify the stock market trades that have huge percentage gains potential.

Other breakouts are usually caused by new fundamental potentials within a company’s product potential. Whatever causes the new investor sentiment in a stock, the resulting candle or candles provide the information needed that would indicate the upside strength of a new move in a stock price. Dynamic Materials Corp., BOOM, is a good illustration of a breakout. Note in the November chart, after trading for four years between $3 and $4 dollars a share, a news item created a new investor perspective on this company. The fact that the white candle, that broke this stock out, closed near the high end of the trading range was an indication that upon this stock doubling in price in one day, investors still felt confident to stay in the stock and not take profits yet.

Boom Candlestick Breakout

BOOM

Very rarely is a breakout on strong volume and a huge percentage price move going to immediately fizzle and move back down to the previous normal trading area. However, not all breakouts immediately go up. But an inordinately large percentage do eventually move to much higher ground after the initial breakout. For those investors that have been following the stock picks over the past few years, AVII is one of our long-term holds. That “hold” recommendation was based on the promising future potential of this company’s products. But when will that potential become evident?

Seven trading days ago, an announcement about receiving patents created a breakout in AVII. A stock that trades approximately 100,000 to 300,000 shares per day moved up over 100% on over 40 million shares traded. This was a dramatic change of ownership in the stock. The Bearish Harami the following day indicated that there would be some pullback action. Friday’s chart, as can be seen below, formed a Bullish Engulfing signal right at the base of the bullish candle that formed the breakout. The last six days of trading have seen an average of 5 million shares traded each day. The Bullish Engulfing signal reveals that the profit-taking selling may have stopped.

AVII Candlestick Breakout

AVII

The breakout tells us something. There is now a new dynamic in this stock. As with most breakouts, the stock trend has an extremely high probability of moving higher, the first target testing the breakout candle high at approximately $4.20. However, over the longer-term, meaning six weeks and greater, the upside potential could be higher. This is not a specific stock recommendation but it provides some educational background on breakout situations. AVII fits into that category.

Struggling Stocks – How Do You React?

On Wall Street, the old saying that “no news is good news” does not seem to hold true with struggling stocks. During the first week of November, 2006, the stock market struggled amid subdued trading as traders waited for indicators on the overall health of the US economy. Although oil prices fell and Boeing Co. was a stock market mover with its huge military contract victory, there was very little to talk about as stocks struggled.

Although the stock market news of the Democratic victory in the mid-term elections did spur a sell-off, stocks struggled as experts and analysts attempted to predict the changes in store as the Republicans lost power. This shift in the balance of power touched off concern about industries from health care and pharmaceuticals to energy and defense. Experts opined that while the news of falling oil prices was a positive, the markets seemed to be taking a rest in the absence of an announcement or event that could provide a boast. Finding a successful trade when the stocks are struggling is the mark of truly knowing how to invest in stocks.

With the general end of the “earning season” for most companies, investors are looking for signs in the economy that indicate a general slowdown in the rate of inflation. The possibility of additional interest rate hikes continues to loom over the stock market and dampen the enthusiasm of positive news in the market. In these times, investors spend more time looking for hot stock market picks when, as a whole, stocks are struggling.

In times such as these when stocks struggle, traders require a strong stock trading plan. First, an investor needs a successful stock trading system such as Japanese Candlesticks. This provides the trader the ability to successfully analyze the markets. After understanding the movements in the market, the investor can implement trades expecting to make money. When stocks struggle and the market lacks volatility, the trader can look for companies to buy straddle options or buy strangle options. Such moves provide limited risk but unlimited profit potential. Other strategies include: selling covered calls, and buying or selling puts. Since the market is somewhat bearish during a period such as this, the strategies involved tend to have lower risk reward ratios. Although the market is struggling to find profit, that doesn’t mean that the successful trader must struggle. The key is for the investor to shift his, or her, thinking to a more conservative approach and look for opportunities that while offering lower returns, also offer lower risk.

Stock investing systems offer the trader a valuable way to perform technical analysis on companies and their stock to find trading patterns and be able to identify investment opportunities. In spite of the fact that stocks may be struggling, following a trading plan helps the investor to find the companies that are moving and implement trades. A trader cannot simply develop a plan and follow it. This plan should be living and changing as the market evolves. Struggling stocks should only cause an investor to adapt the trading plan, not to quit making money.

Stock Market Correction

The expression, stock market correction, sounds like something was wrong and is now being fixed. Depending upon the point of view of traders and investors involved in the stock market this is sometimes the case. In general a stock market correction is a drop in stock price, usually after a rapid and/or prolonged rise. Typically a decline of as little as five percent and a much as twenty percent in the Dow Jones Industrial Average is the benchmark for a stock market correction. The decline in stock prices happens over a brief period. When stocks decline over a long period it is referred to as a bear market. Unlike bear markets stock market corrections are secondary market trends. A stock market correction is a market reversal superimposed on a steadily rising bull market. Using technical analysis tools such as Candlestick pattern formations traders are able to distinguish between a stock market correction and the start of a persistently downward, bear, market.

Why does a stock market correction occur? That is the part about something being wrong and needing to be fixed. In both long term investing and in day trading it is important to keep an eye on intrinsic stock value. Stock prices may go up and give the impression that there is no end in sight. When this happens stocks become “over bought.” Latecomers to a market rally will try to buy in with the hope of obtaining profits before the trend reverses. Those who bought stock early in a market rally will start to worry when the price to earnings ratio of their stock rises too high to be supportable. One quarterly report with flat profits in key industries will commonly spook many investors who will rush to the exits, selling stock as they go. Likewise smart investors will simply take a little profit as the market heats up. In either case the selling pressure on the market drives prices down.

The trader or investor who uses Japanese Candlestick analysis will commonly see this coming and be able to sell stock or sell short just before a market reversal. Likewise, when the stock market correction happens the savvy trader reading Candlestick patterns can see when a correction has run its course and will often be able to buy stock to reverse short selling or even buy more stock as the market heads upwards again.

When the stock market moves up or down dramatically it is critical to have technical analysis tools such as Candlestick charting techniques on your side. The psychology of trading and the psychology of investing are such that it is easy to become fearful or to become greedy when what the person needs to do is thoughtfully analyze the stock market signals in order to profitably buy or sell stock, engage in buying calls or buying puts, or simply sit tight while the panic subsides. Seeing a stock market correction for what it is will allow the investor who was caught by surprise to ride out the storm and regain his or her stock value in a short time. Seeing a stock market correction coming will allow the same investor to buy puts on the same stock. When the price corrects the investor will execute the options contract and get the strike price for the stock. Afterwards he or she can repurchase the same stock at the now lower price spot price and resume a comfortable ride in the resuming bull market.


Market Direction

How do you tell if a trend is merely correcting or had a full-scale reversal? This is the question many investors find debilitating as far as taking profits.  Not knowing how to recognize a profit-taking pullback versus a full-scale reversal makes it difficult for most investors to close out a long position. This leads to one of the most prominent fears most investors encounter. “Do I take profits here or hold on in case the price turns around and heads higher?”

This problem is dramatically diminished if one can identify what the general market trend is doing. As seen in the Dow chart, there were signs that indicated a high probability that profit-taking would be occurring. After the strong bullish candle moved the Dow away from the T-line, while the stochastics were indicating overbought conditions, the appearance of candlestick sell signals produced a high probability scenario that it was time to take profits. However, many investors fear that if they took profits at that level, they would have been fooled out of good positions. This fear stems from the fact that up until not too many years ago, most investors had no indicators they could study to show when it was time to be in or out of positions. Most of the time, closing a position had more to do with a stockbroker recommending it was time to take profits or in other words, it was time to produce some commissions.

DOW Nov. 18

DOW

With the whole array of investment indicators at our fingertips, an investor can make much better assessments as to whether merely profit-taking is occurring or the sellers are trying to bail out of the market. Note how the Dow pulled back with indecisive candle formations. This illustrated there was no ‘convincing’ strength to get out of the market. Price patterns also become an advantageous tool. Knowing what should result from the development of a price pattern allows an investor to make a much better decision for when to get back into a trade.

Additionally, there are a number of subtle indicators that tell an investor what the general investor sentiment is during specific market conditions. Witnessing a good number of stocks continuing to trade positive in spite of the market moving down provides important information. Buyers are not vacating the market in a panic. When a good percentage of stocks are continuing higher as the market in general is heading lower, it can be assumed the selling has not turned into a mad rush.

When up trends are not producing exuberant buying assessments from the so-called professionals, this also diminishes the panic factor when the market moves south for a few days. An uptrend can produce visual evidence with a strong up moves but mild pullbacks. As seen in the ATW chart, the uptrend maintains good strength when there is profit-taking along the way. This can be seen with much more clarity when using candlestick charts.

ATW

ATW

Learn how to use the information built into candlestick charts and you will be able to assess price movement with the same expertise as professionals who have been doing it for years. There is an immense amount of information built into candlestick charts. When you utilize that information for establishing trade positions, you put the probabilities are greatly in your favor.

Chat session tonight at 8 PM

Good Investing,

The Candlestick Forum Team

Stock Price Volatility

Stock price volatility is an indicator that is most often used by options traders to find changes in trends in the market place. There are two main types of stock volatility including historical volatility and implied volatility that are used in the options markets. The increase or decrease in volatility results from changes in investors emotions in the market place. More specifically greed and fear in the market place are the two main factors that cause stock prices to change. Stock price volatility tends to rise when there is new information released in the markets however the extent to which it rises is determined by the relevance of that new information as well as to the degree in which the news surprises investors. In today’s article we will discuss both types of volatility and how each type is used. 

Historical volatility, often referred to as actual volatility and realized volatility, is the measure of a stock’s price movement based on historical prices (stock price history). and it is used to measure how active a stock price typically is over time. It measures the fluctuations in the share price, and more specifically it is measured by taking the daily percentage price changes in a stock and calculating the average over a specific time frame. It makes sense that long term investing requires the use of longer time frames to calculate the historical stock price volatility (60-day to 360-day) while short term investing requires the use of shorter time frames (5-day to 30-day).

Implied volatility is the current volatility of a stock and is estimated by its option price. In other words, the implied stock price volatility is that level of volatility that will calculate a fair value that is equal to the current trading option price. When looking at an option to determine its implied volatility, there are five parts to take into account. These include the strike price, the expiration date, the current stock price and the stock dividends paid by the stock. Investors will then use an options pricing model, using these parts, to find the implied volatility. This calculation is often used to find an option’s value in the market. When options trading, investors will use this calculation when setting up combination strategies. These investment strategies are used to find expensive or cheaper options. It is important to note however, that each option on a stock can and will most likely have a different implied volatility because there different strike prices and expiration dates.

The stock price volatility can also be useful for non-options trading as well. Traders must be very careful when doing this and should combine volatility with other technical indicators. Implied volatility tends to be a leading indicator of stock direction. For instance, when a stock falls and the implied volatility doesn’t change, the market doesn’t really worry about it. Conversely, if the implied volatility rises, then the market is nervous about the stock’s downside potential.

There is a lot more to the stock price volatility that every investor should know and understand, especially those investors interested in online options trading. The importance of understanding the fundamentals to trading and investing in stock cannot be stressed enough.


Market Direction

When the markets become extremely volatile, that usually prelude’s a change of investor sentiment. As we have witnessed in the Dow over the past few weeks, the daily trading range has expanded to 400 to 800 points a day. These excessive swings in daily trading illustrate the indecision that is going on between the bulls and the bears. This becomes vital information for investors. After the strong bearish move following the Dumpling Top pattern, the next question becomes whether the consolidation that has occurred, over the past week and a half, was ready to form a bearish J-hook pattern or a bullish double bottom. Until that can be answered, the risk factor of being exposed to the market was too great. Consider your own emotions during the past few weeks. When the market is down 777 points, it is very difficult to find any reasons to be bullish. More than likely, the fear of what might be going on in our economy was probably enhanced. The major benefit of candlestick analysis is the visual depiction of what direction investor sentiment is likely to move. Today’s bullish trading; bringing both the Dow and the NASDAQ up through the T-line provided more evidence to the bullish side. Until today is trading, it could not be clearly evaluated whether the T. line was acting as resistance or not.

DOW, Oct. 20

DOW

Price volatility becomes a valuable input when utilizing candlestick signals. As seen in the Dow, the reasonal bottoming action has revealed more bullish candlestick signals than bearish candlestick signals. Add that information to the fact that stochastics were slowly moving up, today’s strong close provides more evidence that the Bulls appear to be taking control. The next confirmation would be a close above the 9450 area, a reasonable resistance area. The longer prices appeared to stabilize, the more likely the markets ‘fear’ will dissipate.

NASDAQ,, Oct. 20

NASDAQ

When the indexes are showing bottoming signals, our scanning procedures will likely find individual stock charts with the same patterns. As can be seen in the NASDAQ chart, it is forming a stutter step bottom. It is not difficult to find numerous individual stock charts with the same pattern set up. As often discussed in our evening chat sessions, it is much better to find stocks that are moving in the same direction as the market in general. Why go against the current? The probabilities of being in a correct trade are increasingly improved when the market and the sector are all producing the same bullish patterns. Candlestick analysis is merely the implementation of common sense investment procedures put into a graphic depiction. It allows an investor to put all the probabilities in their favor.

HK Bottoming Action

HK

Do you want to have a much better understanding on which way the market is moving? Do you want to be able to find the best probability individual stock trades in those market conditions? If you are not a member of the Candlestick Forum, you are missing out on the immense amount of information that is provided by candlestick signals. Our daily chat room involves constant analysis of what signals and price movements are revealing. The best method for learning a trading program successfully is to have a community of investors that are all assessing the same information at the same time. When you back up the live information with over 500 pages of Candlestick Forum information, you get a much better grasp of how the successful investor looks at the market. Take advantage of the membership special this week. This is the time to be learning how to understand what the market movements are telling you. You will not be disappointed with the amount of insights you gain from working with other candlestick investors. Join us today. The information you gain from candlestick analysis will benefit your investing for the rest of your life.

Chat session tonight at 8 PM ET for members only.

Good investing,
The Candlestick Forum Team


This Week’s Special
Free Video Download with Monthly Membership Purchase
Free video PLUS EXTRA Free Month with Annual Membership Purchase

Website special reflects current newsletter. If you are reading an archived newsletter you will be directed to Current Website Special.

Commodity Supply and Demand

Fundamental analysis in commodity trading has to do with anticipating commodity supply and demand. Successful traders who sell commodity futures and those who buy commodity futures learn and follow the various aspects of commodity production. Gold futures are affected by the fact that gold mining companies are digging deeper for gold in developed countries and exploring in politically unstable regions of the world. Corn futures are affected by drought, flooding, and the worldwide acreage planted. Oil futures are affected by disasters such as the BP oil spill in the Gulf of Mexico. Commodity supply and demand is the basis of commodity price. Anticipated commodity supply and demand is the basis of commodity futures price. Commodity demand rises for industrial metals like copper and energy commodities such as natural gas during an economic recovery. Thus commodity supply and demand together determine commodity price. To understand how commodity supply and demand, as well as market factors, determine commodity prices a new trader ought to consider Commodity and Futures Training. For the more advanced trader in commodity options a course such as Options Training with Stephen Bigelow can be very useful.

Traders in commodities buy futures and sell futures. Buying putsbuying callsselling puts, and selling calls on commodity futures is also done and can be profitable as well. Trading supply and demand has to do with fundamentals of the individual stocks, options marketscommodities, and futures of the equity market that one is trading. Technical trading has to do with anticipating the actions of others in the market. Unlike trading other equities basic supply in the case of commodities really has to do with just how much of the commodity there is for sale, not how much stock, for example, is available at a given price. Demand for agricultural commodities has to do with how many hungry people there are and how much they can pay for rice, wheat corn, milk, eggs, and meat. Demand for energy commodities goes with a thriving economy as well as severe northern winters. It drops during a recession and when a northern hemisphere January is mild.

Successful options trading in commodity futures is just as strongly related to commodity supply and demand as is buying and selling commodity futures. Buying options gives the buyer the option but not the obligation to purchase or sell if commodity futures price movement is beneficial. Selling options on commodity futures entails the same set of risks as buying and selling stock options. It tends to be more profitable over the long run but can result in occasional substantial losses. In commodity options, just like stock options, it is the large investment houses and companies with deep pockets who typically engage in options trading of commodity futures. All trading in futures and options may ultimately depend upon supply and demand. However, the business of buying and selling at the optimal price is most commonly and most efficiently assisted by use of technical analysis tools such as Candlestick analysis. In the end, everyone knows the fundamentals and it is the ability to predict the sum total of what other traders will do that leads to profits.

How Does Crude Oil Affect The Markets?

Oil prices are still having an effect on the market trends. However what used to be a potential damper on the DOW’s and NASDAQ’s upward movement might now be a stimulant. Crude oil future prices showed signs of bouncing off the 50 day moving average this past week but on Friday, the crude oil chart formed a bearish engulfing pattern. A lower open on Monday may indicate that the consolidation. At the 50 day moving averages over and may be ready for its next down leg. If we see that occur, that could be adding strength to the market indexes. Candlestick charts make this analysis very easy.

October Crude Oil

Note the distinctive Bearish Engulfing signal three weeks ago. The pullback came back exactly to the obvious support, the 50 day moving average. At that point, the stochastics were in the oversold condition when witnessing the doji forming right on the 50 day moving average. From there it acted as a support level for crude oil prices. However, on Friday the bearish engulfing signal, although it came right back to the 50 day moving average, might indicate further weakness in oil prices if we see a weak trading day on Monday. A breach of the 50 day moving average could make the next target at the 200 day moving average at the $35.60 area. 

Oil prices declining to $36 a barrel would put some new life in the stock market indexes. This past week the semi-conductors charts revealed a very strong reversal signal. The majority of the stocks in that sector have been in a steady decline for the past few months, some giving up more than half their price value. As mentioned in the morning comments area this past week, when a large number of charts, all in the same sector move with the same patterns, especially with gap ups following major reversal signals, it is a sign that the whole industry has had a dramatic change in investor sentiment. The gap-up buying indicates that a lot of force has entered the positions. Review our recommended list and study the semiconductor charts in general. The best time to participate in profitable price moves is when the moves are just beginning. The initial buying is now being hampered by any profit taking until higher levels.


Market Direction – For the past week or so, the moving averages have come into play in the recent market trends. The NASDAQ spent a week trying to come up through the 50 day moving average. Although it had some weak signals as it approached the 50 day moving average, it never had any trading to the downside that confirmed the weak signals. You’ll note in the NASDAQ chart that although the stochastics were pulling back, the price movement traded relatively flat. This was a sign that a consolidation period was in affect versus a reversal. The trading of Thursday and Friday turned the stochastics back in upward direction. The close above the 50 day moving average on Friday, with stochastics facing up, should now give us the potential target of the 200 day moving average. Remember, that is now a potential target, the signals should reveal if and when that target might be hit.

NASDAQ Response to Oil Price Change

NASDAQ Response to Oil Price Change

Note how the stochastics showed a downward bias after coming up to the overbought area while the Nasdaq prices held fairly steady. As you may have seen in the market comments through this time period, it was recommended to have a mix of both long and shorts until the trend of the market could be identified. The trading of Friday demonstrated what the investor sentiment was going to be when testing the 50 day MA. Anticipate more days to the upside.

Likewise, in the Dow chart, prices came up through the 50 day moving average. For a couple of days, it pulled back, but did a hammer signal on Friday. This revealed that they did not want to close at below the 50 day moving average. The next resistance should be the trend line coming through the tops of the trading in April and June. A close above the June top would indicate that the slow waffling downtrend may be turning into an upward trend.

Stock market community at the Candlestick Forum site

A stock market community has many benefits when learning a new investment technique. The stock market community that has developed at the Candlestick Forum site is a valuable tool for learning how to use candlestick signals correctly. Members have the opportunity to be part of the stock market community participating in the chat room. That chat room becomes a useful tool for solidifying candlestick analysis thought processes. The chat room, as well as the forum, provides a format for asking questions and getting answers that may have a different perspective. Going through a learning process benefits greatly when different analytical aspects can be brought to your attention.

The stock market community on the chat room produces immediate feedback. The creation of a community that is all in the process of trying to learn how to improve their investment abilities is a valuable asset when an investor wants to clarify how candlestick signals should be analyzed. This same stock market community receives the benefit of the Monday night members chat session. This session goes more in-depth into the existing positions that have been recommended on the site. An explanation of why the position was established and when to close out the position becomes instrumental for an investors learning curve.

Candlestick analysis is very simple. It becomes much easier to learn with constant contact with an investment group. Learning any new investment technique creates questions. When those questions can be answered immediately and by many different levels of experience, a much more concise analysis can be learned in a much quicker time frame. The 12 major signals are the core of candlestick analysis. Learning just those 12 signals provide more trading opportunities than most investors will ever require. To become successful in the stock market community, an investor should learn how to use these 12 major signals effectively. They not only illustrate when to get into a trade, knowing what each one is supposed to illustrate as far as investor sentiment, makes profit taking and stop loss procedures very easy to implement. Click here for the 12 major signal training package special.

Market direction – What could have been the possibility of a Blue Ice Failure has now completely changed. Being able to recognize what patterns may be setting up and what candlestick signals are forming allows an investor to shift portfolio positions immediately if a pattern is not working. The failure of the 50 day moving average by the Dow on Tuesday created the possibility of a Blue Ice Failure pattern which would anticipate the next target being the 200 day moving average. However, the bullish candlestick signals changed that scenario.

Dow 4
Positive NASDAQ on a Day with an Indecisive Dow

Not so much in the Dow, but the bullish signals appeared in the NASDAQ and the S&P chart. Both had Bullish Haramis formed on Wednesday. This was the immediate indication that the selling had stopped. That information now negates the possibility of a Blue Ice Failure. A new scenario should now be analyzed.
What happens the first time a major moving average is touched? Usually it fails. But the next approach usually breaches that moving average. With the Bullish Haramis in the NASDAQ and the S&P chart, indicating bullish strength, the analysis on the Dow should be anticipating the second approach of the 50 day moving average to breach that level. This analysis diminishes the negative sentiment that was revealed on Tuesday. 

Finding Stock Price Breakouts Using Candlestick Signals

One of the most profitable trading strategies is identifying stock price breakouts. Stock price breakouts incorporate one simple element. Something new and dramatic has occurred in a stock price, making it extremely desirable for investors to get into the position quickly. A breakout pattern is very easy to scan for and identify. Utilizing Candlestick signals creates an easy platform for maximizing profits once a breakout has occurred. The signals provide the ability to determine whether to get into a stock trade after a huge percentage move immediately or wait for the profit-taking pullback. This can be done with some very simple analytical techniques.

Breakouts occur due to a change in world events or a dramatic change in the fundamentals of a company. As illustrated in the INVN chart, a world event changed the fortunes of this company. 9/11 made the product of this company a high profit potential.

INVN is a manufacturer of the luggage scanning machines for airports. The interest in their product after 9/11 moved the stock price from $2.50 to over $45 in approximately 4 months. What was the best way to trade this position? The black candle on the breakout day provided a much different scenario than if a white Candlestick had formed that day. How investors react to news, whether a world event or a product specific announcement for a company, has a great influence on how the trend will perform from that point.

INVN Breakout

INVN

Currently the AVII chart is illustrating a breakout situation. Recent news announcements have taken the lethargic trading into new recent highs. Volume becomes a very important factor for identifying a breakout situation. The probabilities are extremely high that once a breakout in price occurs, especially out of a very boring trading pattern, the uptrend will continue for a reasonably long period of time, due to the new interest that has come into the stock. The large volume trading days, going from approximate 200,000 shares a day to well over 2 million shares a day clearly demonstrates that new interest has entered the stock.

Once large percentage gains have occurred, pullbacks should be expected. How these pullbacks are portrayed with Candlestick signals is a very important factor for evaluating whether a profit-taking pullback is occurring or the uptrend is over. Having this knowledge greatly enhances the ability to ride through a strong positive move without getting out too soon.

AVII Breakout
AVII

Market Direction – The Morning Star signal in the Dow with stochastics in the oversold area has been the overriding reversal signal. What could have been a potential of a Double Bottom, or at least a test of the recent lows, was eliminated as buying brought the Dow index back up through Wednesday’s open. Wednesday’s Bullish Engulfing signal with stochastics closer to the oversold area than the overbought area illustrates that the buyers are still in control. The profit-taking of Tuesday and early Wednesday adds to the health of this uptrend.

Dow Breakout

The Dow

Continue to hold long positions in strong sectors. The uptrend should eventually test the 50 day moving average and the 200 day moving average.