All traders and investors want to buy stock at the lowest possible price and sell stock at the highest stock price. Just how do we do this? Fundamental analysis tells us what stocks are capable of but does not tell us just how high or low stock prices will go or just when they will peak or bottom out. Whether one is trading stocks directly or trading derivatives as in options trading or futures trading, timing is of utmost important in gaining trading profits.
Stock price pattern analysis tells the trader what the market is about to do. Using technical analysis tools such as Candlestick pattern formations traders can, in the words of Candlestick traders, let the market tell them what the market will do. Stock price pattern analysis works because stock price patterns repeat themselves, especially in large and fluid markets. Although everyone can do the fundamental analysis on a stock not all will trade that information the same. In addition, traders react to market movement and commonly drive a stock price higher or lower than the stock fundamentals dictate. It is from the ebb and flow of stock prices that stock price pattern analysis leads to profits.
Stock price pattern analysis is the basis of the technical analysis of stocks. Stock price pattern analysis comes down to comparing known patterns with what is evolving on the chart in Candlestick chart analysis. In a sense price patterns have a front half and a back half. Since, in our universe, time only moves in one direction, the front half predicts the back half in stock price pattern analysis. For example, when the stock market is coming to a consensus on a stock price the price pattern will often look like a wave form that is shrinking as it moves along. If one charts the movement of stock prices and draws a line from peak to peak and trough to trough it will look like two converging lines. If we imagine that the base of these converging lines is connected we have the makings of a triangle. When the upper side of this triangle is horizontal and the lower portion ascending this pattern often is indicative of a market coming to a consensus before an upward breakout in the stock price, a one stock market rally. This is an ascending triangle pattern. When the upper side is descending and the lower is level it is typically a bearish indicator and the stock will often break out to the downside.
There are many signals that are of use in stock price pattern analysis. A primary and very useful feature of Candlestick patterns is that the system is very visual. It contains all of the information of the markets but is typically easy to read and understand. Both the savvy day trader and those interested in long term investing can use stock price pattern analysis to buy stocks and sell stocks at the most advantageous and profitable prices. An old expression about learning about stocks was learning how to play the stock market. This expression dates back at least to the 1920fs before historyfs worst stock market crash. What traders and investors learned in the aftermath of that economic disaster is that a more disciplined approach to investing and trading can be profitable and is in no way the sort of gambling implied in this old expression. Using both fundamental and technical analysis pays dividends. Using a tool such as Candlestick chart analysis effectively helps predict the future by current stock price patterns to historic stock price movement.
Market Direction
There is a universal thread throughout candlestick analysis. Each aspect of investing, using candlestick analysis. utilizes one basic premise. It is purely common sense and it consistently puts the probabilities in the candlestick investors favor. The description of investor sentiment involved which created a candlestick signal or pattern is easy to understand. Each signal merely reveals what was occurring in investor sentiment. This knowledge allows investors to make rational decisions. Is it time to buy? Is it time to sell? Is it time to continue to hold? The signals and patterns utilized in conjunction with other confirming indicators produces high probability results.
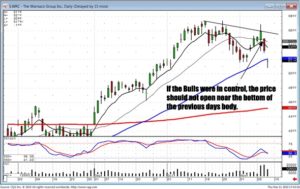
These same favorable results can be applied to each aspect of investing. Knowing what each signal has conveyed, and knowing where it occurred in regards to confirming indicators, the analysis to enter or exit a trade also becomes easy to execute. Common sense questions and answers allows an investor to make decisions that dramatically improve the probabilities of when to enter a trade or not. There should be a logical result if there is logic built into candlestick buy signals. That logic may be as simple as what should be expected after seeing a candlestick buy signal? The answer should be simple. There is evidence the buyers are still participating. As can be seen WRC chart. It had a set up for a bullish trade. If this trade was going to be executed after the large Bullish Engulfing Signal, what should be witnessed? Evidence that the bulls were still in control. When the price opened at the lower end of the previous days body, that does not reveal the presence of bullish strength. This is where the trade would not have been executed.

WRC
Although this is not rocket science, many investors will disregard the common sense aspects of investing and put on the trade. What is usually their rationale? They were buying at a lower price than where they expected, anticipating this trade should move higher. What they do not account for is the fact that there was no evidence the Bulls were going to be taking the price higher. What is usually the basis for buying at a lower price? Ego! Everybody wants to buy as low as possible and sell as high as possible. Unfortunately, that methodology does not necessarily equate to buying at high probability times.
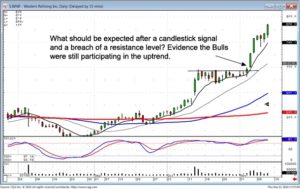
The WNR chart reveals a different evaluation. The price continued to push against a resistance level without retracing. For this to be a successful trade, what should be expected after the little buy signals in early November? Bullish confirmation! Because the ego wants to buy at the absolute bottom and sell at the absolute top, most investors consistently lose money. The candlestick investor has the advantage of buying when the chart/signal says to buy and sell when the chart/signals say it’s time to sell. When you take your ego out of the investment decision, the probabilities of being in the right trade at the right time improve exponentially.

WNR
Chat session tonight at 8 PM ET. Everybody is welcome. Learn how to distinguish when it is time to buy and sell based upon the candlestick signals and the premarket futures.
Good Investing,
The Candlestick Forum Team
Speak Your Mind