Archives for October 2019

Futures Trading Advisors – Who’s Going to Help You

Deciding on a futures trading advisor is actually more of a decision about commitment. Some people want no sense of responsibility beyond depositing money in their commodities account while others want to grab the bull by the horns and make all of the decisions themselves. Each successful trader has one unique trait: the ability to know oneself and seek the futures trading advisor that will best help that investor.

There are four basic ways to manage a commodity account. Each method has its advantages and best fits certain personality types. These four methods of account management are: trading your own account, enlisting an account manager, using a commodity trading advisor and joining a commodity pool. No matter which method you choose, there is a futures trading advisor that can help you with your commodities trading. Here is a brief introduction to each method.

Trading Your Own Account

This is the most daring method of the bunch. With this method, you start a commodity account and with or without the help of a futures trading advisor, taking responsibility for your own trading decisions. You will do your own research, ensure adequate funds are available in your account, and initiate your own positions. Many brokerage houses have divisions related solely to futures investing and some even cater to those who manage their own accounts, focusing their efforts on providing the most comprehensive, up-to-date information available. This is the most economical method of the bunch since the only expense you have is maintaining the account and paying premiums on your trades. This type of account is only intended for those with significant experience in commodity trading.

Having Someone Manage Your Account

This is the “play it safe” method. When a futures trading advisor manages your account, he or she will have power of attorney power to make and implement decisions for you. You will still be contacted to all investment options that your account manager suggests and you are financially responsible for your account, but you are counting on someone that is a professional to do the dirty work for you. This is a good method for someone who doesn’t have the experience, training or time to successfully handle an account; you are able to rely on the experience of your account manager.

Utilizing a Commodity Trading Advisor

This method is somewhere between the previous two. A commodity trading advisor is someone who is paid to offer advice on commodity trading, including specific trading recommendations such as when to establish a particular long or short position and when to liquidate that position. A commodity trading advisor will help you with your investment philosophy but is not assigned specifically to your account. This method offers the ability to manage your own account yet have the advice of an expert at your fingertips.

Participating In a Commodity Pool

The final method of account management is called a commodity pool. This method is similar to a stock mutual fund. It is the only method that does not require you to have your own individual trading account; the money you invest will be combined with that of others in the pool and traded as a single account. The risks are the same as an individual account but the increased funds can enable you to make a wider variety of investments.

Stock Market Movers or Stock Market Stinkers?

Stock Market Movers – don’t get me on a rant! I tried to find relevant advice for finding these gems of the market. Instead, I found a plethora of websites proudly displaying nothingzipnada to assist an investor on furthering their education. Please, just a little tidbit that evenly remotely relates to stock market movers would be nice! But NO, the ever increasing familiar lists of everything from Art to Sports and how did anyone work in Stock market movers into a Home and Garden website. Somebody help me! I’ve experienced the same frustration of the rest of the internet community and this website continues to provide FREE, on-going, training materials to help anyone find stock market movers with high profit potential.

Stock Market Movers are easier to spot with candlestick patterns. Stock research for finding stock market movers can become very complex. However, the trained candlestick investor sees the familiar candlestick patterns and immediately knows whether a specific stock pattern merits any further of his time and attention. Some so-called stock market movers turn out to be stock market stinkers!  You can surf the net looking for stock market movers or you can spend your time learning candlestick signals. My vote is obvious, check our website each week, we promise to continue to deliver new training material. Learn the Candlestick Signals. Below is a favorite pattern, which demonstrates some very anxious sellers.

Trading the Three Identical Crows Pattern

3 Identical Crows

Three Identical Crows

Description

The Three Identical Crows have the same criteria as the Three Black Crows. The difference is that the opens are at the previous day’s close.

Criteria

  1. Three long black bodies occur, all of close to equal lengths.
  2. The prior trend should have been up.
  3. Each day opens at the close of the previous day.
  4. Each day closes near its low.

Pattern Psychology

After an uptrend a long black candle forms. However, the selling is more sever. There do not appear to be any buyers at the next day’s open. The long black candles, having a stair-stepping pattern to them, indicates a much greater motivation to get out of the position.

Training Tutorial

Candlestickforum Flash Cards  These unique Flash Cards will allow you to be “trading like the Pro’s” in no time.

Return to Candlestick Explanation for Secondary Signals

Stock Market Basics Revisited

As the days get shorter and the seasons begin to change, another rite of passage occurs. Junior is packing his lunch and books for the trip back to school. While the average adult no longer visits a classroom, the average investor as the days get shorter and the seasons begin to change, another rite of passage occurs. Junior is packing his lunch and books for the trip back to school. While the average adult no longer visits a classroom, the average investor can always use a little help with investing. Revisiting some stock market basics from time to time can be very beneficial.

Stock Market Basic 1: Volatile Markets Make Bad Stocks Look Good

Always remember, if it walks like a duck and quacks like a duck, it’s probably a duck. This stock investing concept is obvious to the seasoned investor; active markets lure the investor with promise of great gains. Just because a company can gain funding doesn’t insure that it has a solid business plan or is a strong investment option. A plan such as the candlestick basics should help even the most experienced investor avoid this pitfall.

Stock Market Basic 2: Investing is a Game of Chance

Gambling (interpreted as day trading, IPO flipping, buying on hot tips, etc.) is best left at the poker table for the average investor. The dynamics of the market may change, but the basics of stock market investing are always the same. Investing requires insight, and not just the hot new buzz of the day. It requires a plan for long term investing.

Stock Market Basic 3: Follow the Beaten Path

The market has been a saga for years. Fortunes made and lost, ups and downs experienced, and in the end, most of the tried and true rules remain for true. This basic stock market principle is not lost on the giants of investment, who consistently find the highs and lows in the market and capitalize on them. Whether investing in currency trading or option trading, the lessons learned by others and passed down are almost always the best.

Stock Market Basic 4: The Job is Always Easier with the Right Tools

This lesson conjures images of being under the hood of that old car, but the stock market principle here is directed to stock market trading tools used in working the market. There are many programs available, all of which offer their theories and charts to add credibility to their claims. Finding a proven system using candlestick trading tactics is exactly the tool needed to make your goals in the market a reality.

Stock Market Basic 5: Why do the Answers Change as Soon as I Figure Out the Questions?

Asking intelligent questions of people who have been in the stock market community for awhile is a great resource and it is the final basic stock market principle revisited. FAQ’s, expert’s columns, stock market newsletters and the like are prime examples and excellent resources for learning what has worked for others.

Or can always use a little help with investing. Revisiting some stock market basics from time to time can be very beneficial.

Stock Market Basic 1: Volatile Markets Make Bad Stocks Look Good

Always remember, if it walks like a duck and quacks like a duck, it’s probably a duck. This stock investing concept is obvious to the seasoned investor; active markets lure the investor with promise of great gains. Just because a company can gain funding doesn’t insure that it has a solid business plan or is a strong investment option. A plan such as the candlestick basics should help even the most experienced investor avoid this pitfall.

Stock Market Basic 2: Investing is a Game of Chance

Gambling (interpreted as day trading, IPO flipping, buying on hot tips, etc.) is best left at the poker table for the average investor. The dynamics of the market may change, but the basics of stock market investing are always the same. Investing requires insight, and not just the hot new buzz of the day. It requires a plan for long term investing.

Stock Market Basic 3: Follow the Beaten Path

The market has been a saga for years. Fortunes made and lost, ups and downs experienced, and in the end, most of the tried and true rules remain for true. This basic stock market principle is not lost on the giants of investment, who consistently find the highs and lows in the market and capitalize on them. Whether investing in currency trading or option trading, the lessons learned by others and passed down are almost always the best.

Stock Market Basic 4: The Job is Always Easier with the Right Tools

This lesson conjures images of being under the hood of that old car, but the stock market principle here is directed to stock market trading tools used in working the market. There are many programs available, all of which offer their theories and charts to add credibility to their claims. Finding a proven system using candlestick trading tactics is exactly the tool needed to make your goals in the market a reality.

Stock Market Basic 5: Why do the Answers Change as Soon as I Figure Out the Questions?

Asking intelligent questions of people who have been in the stock market community for awhile is a great resource and it is the final basic stock market principle revisited. FAQ’s, expert’s columns, stock market newsletters and the like are prime examples and excellent resources for learning what has worked for others. 
 

Commodity Trading with Candlestick Signals and the Bearish Harami

Commodity trading principles are the basic elements incorporated in the candlestick signals.  Commodity trading principles are easier to analyze than stock trades.  This is derived from one simple factor.  Commodity trading principles are based upon supply and demand.  Whereas stock analysis involves a multitude of external factors that can affect a price, commodity trading principles relied mostly upon the perception of supply and demand.  This creates a much smoother trend analysis than stock prices.

Candlestick signals were developed on the most basic commodity trading principles.  400 years of investor observations occurred while trading Rice, one of the most basic commodities. Over the past four centuries, the 50 or 60 candlestick signals became recognized.  Of these, 12 signals were found to occur a majority of the time.  Their appearance also indicated extremely high probability reversal situations.  These 12 signals are now considered the major candlestick signals.  Learning these signals allows an investor to gain valuable insights into investor sentiment.

Understanding the investor psychology that formed the major signals is the basis for fully understanding commodity trading principles.  The facets of supply and demand do not immediately change commodity prices.

The perception of what supply and demand forces may be doing is what changes commodity prices.  Candlestick signals are the graphic depiction of those reversals in investor sentiment.  Understanding the factors that go into a candlestick signal formation makes understanding commodity trading much easier to comprehend. You can follow Stephen Bigalow’s live futures and commodity trading account.

The Bearish Harami is one of the major signals that exhibits common sense  into graphic depiction.  Candlestick analysis provides a clear understanding of what happens to investor sentiment at the reversal areas.  The elements that create a Bearish Harami produce clear insights into what was going on in investor minds at a reversal.

Bearish Harami
BEARISH HARAMI

Description

The Bearish Harami is the exact opposite of the Bullish Harami. The pattern is composed of a two-candle formation. The body of the first candle is the same color as the current trend. The first body of the pattern is a long body; the second body is smaller. The open and the close occur inside the open and the close of the previous day. Its presence indicates that the trend is over.

Criteria

  1. The body of the first candle is white; the body of the second candle is black.
  2. The uptrend has been apparent. A long white candle occurs at the end of the trend.
  3. The second day opens lower than the close of the previous day and closes higher than the open of the prior day.
  4. For a reversal signal, confirmation is needed. The next day should show weakness.

Signal Enhancements

  1. The longer the white candle and the black candle, the more forceful the reversal.
  2. The lower the black candle closes down on the white candle, the more convincing that a reversal has occurred, despite the size of the black candle.

Pattern Psychology

After a strong uptrend has been in effect and after a long white candle day, the bears open the price lower than the previous close. The longs get concerned and start profit taking. The price finishes lower for the day. The bulls are now concerned as the price closes lower. It is becoming evident that the trend has been violated. A weak day after that would convince everybody that the trend was reversing. Volume increases due to the profit taking and the addition of short sales.

Having insight into the effect of Haramis provides an opportunity to maximize returns. If all of your investment funds are being fully used, a Harami may reveal that one of the positions has stalled for a few days. An aggressive trader may want to move those funds to a better trade, and then come back after a few days to reinvest once the position is moving.

Stock Market Lesson Plans – An Easy Process With Candlesticks

Stock market lesson plans become very easy to follow when utilizing Candlestick analysis. Very simply, over the past two weeks while the Dow Jones was in the oversold condition, a few Candlestick bullish signals appeared. The Tweezer Bottom and the Bullish Engulfing signals illustrated that a bottom was forming.

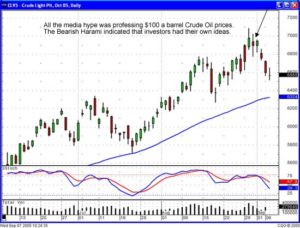
At the same time, all the hype about Crude Oil prices appeared to be running rampant. $100 a barrel oil, what would that do to the US economy? The hurricane, how would that constrict the flow of oil? Gas lines, price gouging, spot shortages, all these things were being touted by the media. However, the Crude Oil chart was showing a Candlestick ‘sell’ signal. That information should have been put into the stock market lesson plans. Despite what the news indicates, the Candlestick signals tell you exactly what investor sentiment is doing.

Lesson-Plans-1

Crude Light

There did the big buying pressure come from this week? The signals had indicated over the last two weeks that an uptrend may be starting. Look for some consolidation , profit-taking after the big move Tuesday, but then look for the uptrend to continue.

Realizing that the market direction is being influenced by Crude Oil prices, stock market lesson plans can be oriented around that analysis. As discussed in the Thursday night training sessions on the Candlestick Forum website, being able to analyze what other market factors are doing becomes additional analytical information for projecting whether to be long or short in equities.

The ease in which Candlestick signals can be utilized for analyzing all trading entities allows the Candlestick investor to quickly evaluate whether their portfolio should be predominately long or short. Outside influences such as Crude Oil prices, interest rates, the strength of the American dollar, or a multitude of other trading entities will at times be the predominate influencing factors on investor sentiment. Being able to identify reversals in those trading entities becomes a valuable tool.

Commodity Prices – Protecting Your Investment

So much of what is written about commodity trading has to do with investment strategy; what you should buy, how much you should pay, or which tropical island you should buy with all of your profits. While the positive side of investing cannot be emphasized enough, an important part of your trading plan is knowing what to do when things don’t go so well. Commodity prices and how they can change require you find ways to protect your investments.
Two of the best ways to protect your investments against commodity price changes are limit orders and stop loss orders. These are both protective orders that help you keep your money, not give it away to changes in commodity prices.

Limit Order

A limit order is a futures trading order that instructs your broker that when an underlying asset reaches a certain price or better, he or she should execute the order and purchase the desired asset at the best commodity price available. If the price of a commodity does not drop to the requested level, your order is not filled.

For example, if the price of corn futures is at $5.00 dollars per bushel and you place a limit order at $4.50, your order will not fill unless the price drops to $4.50. If the commodity price falls from $4.75 to $4.40, your order will be filled at $4.40. Conversely, if the commodity price only falls to $4.55, your broker will not fill the order. This type of market order helps protect your money by getting you the commodity price you want and not filling if your price isn’t reached.

Stop Loss Order

A stop loss order is a commodities trading order that instructs your broker that if an asset you are holding drops to a certain level, he or she should sell it. Once the price has been reached, the commodity broker will implement the trade, regardless of the current commodity price. If the price never falls to the agreed amount, the order will not be executed.

As an example, if you enter a stop loss order to leave a crude oil position you are holding when the price drops to $55 a barrel, your oil futures have these possible scenarios:

  • If the price of oil drops to $55, your commodity broker will enter a market order to sell your position, getting the best available price.
  • If the price of oil drops to $55 but then quickly drops to $54, that may be the price you get. Remember, once the price touches $55, your broker will place a market order but that space of time can allow the price to temporarily drop more.
  • If the price of oil drops to $55 but then quickly rebounds to $56, the trade will be initiated ever though the amount is back above your target for the commodity price. It is likely you will get the $56 but your futures option will still get executed.

How These Orders Help Protect You

Commodity prices in the futures markets have the potential to move quickly. If you are holding a futures contract, it is easy for things to get volatile and your position can become compromised without your even knowing. By using limit orders, you can enter a position at the commodity price you choose, not pay more because you can’t monitor its movement; your broker can do the work of watching the commodity price for you.

Stop loss orders don’t protect you before you make a trade; they protect you AFTER you enter a position. If you are not sitting by the computer watching commodity prices, a negative move could occur before you can move to stop it. By having a stop loss order, you can watch your positions without being in front of your computer.

Conclusion

Stop loss orders and limit orders can help the investor to form part of a strong stop loss strategy. While there is plenty written about profits when commodity prices rise, it’s good to know you have a plan in place in case commodity prices fall.


Stock Market Crash – Not According to Candlestick Signals

There is constant speculation for the next stock market crash.  A stock market crash is always a worry for a certain percentage of the investment community. However, candlestick signals can greatly alleviate that fear.  A stock market crash does not occur in one day, one week, or one month. Selling will occur prior to a stock market crash.
The great stock market crash of October 1929 had clear evidence of selling in the markets starting in August of that year.  Each stock market crash in the 1980s and 1990s did not occur instantly. Candlestick sell signals made it clear that the directions of the markets were bearish well before the crashes occurred in. The signals will reveal the set up for another crash well before it occurs. Currently,  there are no indications that another stock market crash is in the making.

On the contrary, the Dow has been forming a rounding bottom formation for the past three months. This indicates a slow steady consolidation, a reaffirming that investor sentiment is gaining confidence. The fundamentals of the economy, low interest rates, improving earnings, and consistent consumer spending does not bode for anything but a strong steady economy.

Market Direction

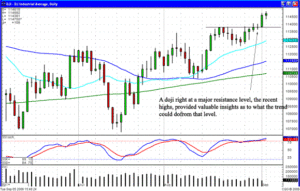
The Dow has recently broken out into new high territory for the past few years.  This occurring after the identification of a spreading pattern that formed in the Dow.  The result of a spreading pattern is a strong trend. In this case, the spreading pattern indicated a strong upward trend.  This could warrant an uptrend that could maintain for the next few weeks. Continue to hold your long positions.
 
Stock Market Crash Not Evident, Dow
 
Dow

The results of these scans in the past couple of trading days reveals strong buying coming back into the oil related stocks.  Although crude oil prices have dropped dramatically over the past month, it appears as if crude oil stock prices have ended their profit taking.  The next move should be a strong move to the upside.  At least one or two positions in the oil related area should be added to the portfolio at this time.

Candlestick Trading Publications and Articles

In addition to his popular books on “Profitable Candlestick Trading”  and “High Profit Candlestick Patterns”, Stephen Bigalow has many articles featured in “Future’s Magazine”, “Stocks & Commodities”, “Trader’s World”, London’s “Morning Star”, and other investment publications.

Refer to this page often to enhance your education on the art and science of using Japanese Candlesticks to trade effectively.

Factors That Affect The Stock Market – Trading the Rising Three Method Continuation Pattern

The ability to analyze factors affecting stock market movement provides an additional advantage for being able to evaluate the direction of the markets. Those factors are not hard to find. They are usually what are being reported on the financial news stations. Recently, Crude Oil has been an influence. Also, the decline of the US dollar has become a factor.

The Candlestick signals provide the insights on how the outside influences will affect the Dow and the NASDAQ. The US dollar has formed a few Doji’s when the stochastics were in the oversold condition. There may be an opportunity for a rally in the dollar over the next few days. There appears to be some strength being shown after the Doji’s. If this is one of the factors that is affecting the stock market, having a better visual concept of what one of the influences is doing makes for a better evaluation.

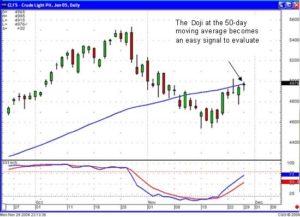
Crude Oil prices, after their decline from the $57 range down to the $46 range, provided strength to the stock market indexes. As anticipated, with the stochastics in the oversold condition, Crude Oil prices bounced back up to the 50-day moving average after it had broken down through that level. Currently, the January futures contract of Crude Oil has been hugging the 50-day moving average. It formed a Doji on Monday, right at the 50-day moving average. This now becomes an easy evaluation. A bullish day after the Doji would send prices up through the 50-day moving average, indicating that the 50-day moving average is not acting as resistance. On the other hand, seeing the Crude Oil prices heading lower after the Doji would reveal that the 50-day moving average was now acting as resistance and it would be feasible to see new recent contract lows in the near future.

Factors That Affect the Stock Market, Crude
Crude Oil

Taking these outside factors into account, it becomes easier to analyze which way the market might go based upon the factors affecting stock market movement. Use the candlestick signals to your advantage no matter which market you are analyzing.

Rising Three Method

Rising Three Method

Description

The Rising Three Method is an easy pattern to see during uptrends. A long white candle forms. It is then followed by a series of small candles, each consecutively getting lower. The optimal number of pull-back days should be three. Two or four or five pull-back days can also be observed. The important factor is that they do not close below the open of the big white candle. It is also preferred that the shadows do not go below the white candle. The final day of the formation should open up int he body of the last pull-back day and close higher than the first big white candle.

Criteria

  1. An uptrend is in progress. A long white candle forms.
  2. A group of small-bodies candles follow, preferably black bodies.
  3. The close of any of the pull-back days does not close lower than the open of the big white candle.
  4. The final day opens up into the body of the last pull-back day and proceeeds to close above the close of the first big white candle day.

Pattern Psychology

The Rising Three Method is considered a rest in the trend or, in Japanese terms, a rest from battle. The concept is that the first black candle day brings some doubt into the bull camp. The next day does the same. By the thrid day, the bulls ar now convinced that the bears do not have the strength to push prices down anymore. The bulls get their courage back and start stepping in. The pattern resembles the Western bull flag or pennant formation, however, the concept was originally developed in the 1700s. In modern terms, the market was just ‘taking a breather”.

Back to Continuation Patterns

Growth Stocks

Growth stocks are those companies with shares whose earnings are expected to grow at an above average rate in comparison to the market. These stocks typically do not pay dividends because the companies opt to reinvest any retained earnings back into capital projects.

There are common characteristics among growth stocks as well as indicators that the stock investor can look for. These indicators can include the following:

1) Strong growth rate – This includes not only historic growth rates but also the projected growth rate when investing in stocks of this nature. The growth rate will vary between small and large companies but typically smaller companies need to have a 10% growth rate for the past five years to qualify whereas the larger companies need to have about 5% – 7% growth rate to qualify.

2) Strong return on equity (ROE) – You must compare a company’s ROE with the industry in which is presides as well as its five-year average when stock investing.

3) Earnings per share (EPS) – The earnings per share is very important as well when investing in growth stocks. Investors must be sure the company is translating its sales into earnings, and management must be controlling costs. Investors must take a look at pre-tax profit margins and they should exceed the past five-year average as well as the industry average.

4) Analysts also take a look at the business model for a company as well as its market position to be sure that this stock price can double in five years.

Growth Stocks vs. Value Stocks

Growth investors look for companies with fast growing revenues and earnings as well as rising stock prices. Growth investing focuses on stocks that are growing and that have the potential for continued growth. Value investors look for bargains. Bargains are stocks that are trading at low prices relative to earnings, or stocks that have low price to earnings ratios. Value investing looks for stocks that the market has under priced and it looks for stocks that have the potential to increase as the market corrects itself.

Which Type of Stock Is Better?

This depends on what is occurring in the stock market. During periods such as the late 1990’s, growth stocks did very well, however there were time periods when value stocks did better. Investors should just be sure to aim for portfolio diversification and shouldn’t only invest in one type of stock.


Market Direction

Simple candlestick rules makes investing very easy. It also makes investing very relaxed. As illustrated in the previous newsletter, maintaining short positions during February and March was not a high anxiety process. What fears creep into investor sentiment as profits continued to grow? Where should I take profits? Should I take it now so I lock in some profits? These questions constantly nag an investor as their short position profits keep growing as a downtrend persists. Too often, positions are closed because of the fear of giving back some of the profits that have built up. This anxiety can be greatly diminished when using simple candlestick rules.

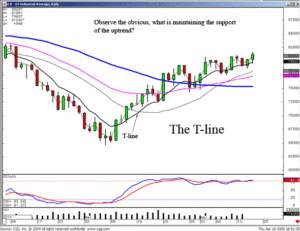
A downtrend will persist as long as there is not a candlestick buy signal and a close above the T. line. This rule works so well, an investor should be comfortable and relaxed with short positions until that combination occurs. The same is true in an uptrend. The Dow has moved up after the first week of March. What occurs in most humans as a trend continues? The anxiety level increases. They become more fearful of losing the profits they have made. This usually changes the investment strategy. The rational decision-making involved with analyzing the charts gives way to emotional factors. The sage investment advice, “Cut you loses short and let your profits run. ” Is a very viable investment process if investors would allow the discipline to work. Unfortunately, because of emotions, the opposite is usually true. The losses become greater while the gains get nipped in the bud because of the fear factor.

Candlestick analysis operates off very simple principles. Buy when the candlestick signals tell you to buy, and sell when the signals tell you it’s time to sell. Many investors have a difficult time when it comes time to sell. They either sell too early, in fear of giving back profits or they sell too late, afraid they might not get all of the price move. Candlestick analysis makes those problems very easy to overcome. The common sense rules the Japanese rice traders utilized for centuries allowed them to maximize profits and minimize losses. The signals and corroborating indicators take the subjectivity out of taking profits.

Growth Stocks, DOW

DOW

Another aspect of investing  benefited by recognizing the continuation of trends involves pattern analysis. Having the knowledge that current conditions of a market trend has not changed allows for the participation in candlestick patterns. These patterns may take much longer to set up. The end result of a pattern has a much better chance of creating huge profits if nothing dramatic  is occurring in the current overall trends. The Jayhook patterns, the Fry pan bottom pattern, the Cradle pattern and the Scoop pattern have better probabilities of success when the markets are gradually trending versus oscillating dramatically.

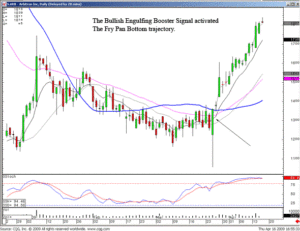
As illustrated in our recent recommendation on ARB, the dramatic buy signal escalated the result of a Fry pan bottom pattern. Since witnessing the Bullish Engulfing Booster signal, the upward trajectory of the trend has been very dramatic. The continuation of this price move as been benefited by the slow gradual uptrend of the markets in general. This trend may have had a much different result had the market indexes been producing a bearish trend.

Growth Stocks, ARB

ARB

The persistence of a trend also allows for the establishment of high profit option trading strategies. A general trending market diminishes the whip sawing actions in option trades that might been  found in more choppy conditions. Being able to analyze the market trend is greatly important for establishing the right investment strategies for the right times of the market. The information incorporated into each individual candlestick signal allows an investor to make much more accurate trend analysis than  other technical methods. The clarity produced by the signal bodies helps determine how heavily long or short a portfolio is positioned.

Chat session tonight 8 PM ET – open to everybody. With these market conditions, what option strategies should be used? Click here for instructions.

Good investing,

The Candlestick Forum Team


Scanning Techniques for Higher Profits

This Week’s Special

Scanning Techniques to Higher Profits – 30% OFF!

Streamline your stock selections with this step-by-step scanning technique.

Click here for details.

Website special reflects current newsletter. If you are reading an archived newsletter you will be directed to Current Website Special.


48 Hour Special

Trading Rules to Successful Profits – 30% OFF