Archives for October 2019

Stock Market Trading Patterns – Enhanced by Candlestick Signals

Candlestick signals make analyzing stock market trading patterns relatively easy. Trading patterns become recognized because of the reoccurring mental processes of investor sentiment. Normal investor decision making is flawed with the input of emotion. The majority of investors are usually wrong. Human emotions are contrary to rational investment decision making. Being able to graphically analyze what investors normally do provides a huge advantage. Candlestick analysis is capturing and analyzing investor sentiment on a chart.

Western analysis has identified many reoccurring stock market trading patterns. Adding Candlestick signals to the analysis creates a huge advantage. Once recognizing that a trading pattern is developing, it can be better analyzed and more accurately timed when applying Candlestick signals. One of the most highly profitable stock market trading patterns is called a “Fry Pan Bottom”.

The Fry Pan Bottom pattern, once analyzed, is very easy to recognize and it is very easy to understand how it forms. This week’s online Candlestick training session on the site delved into the Fry Pan Bottom pattern. Understanding the ramifications of the psychology that forms the Fry Pan Bottom allows an investor to prepare for the potential of a high profit trade.

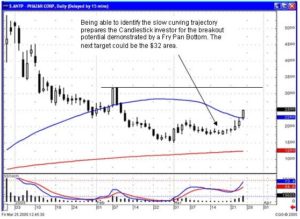
One of the recommendations this past week was Phazar Corp. (ANTP). The recommendation was based on recognizing the set-up for a Fry Pan Bottom. As illustrated in the ANTP chart, a Fry Pan Bottom was forming over the past three weeks. Being able to analyze the formation creates a fairly low risk trade and can be used in an aggressive trader’s strategy as well. Note how the downward trajectory was very slow, followed by a few days of indecisive trading, small Spinning Top signals, then a small Bullish Engulfing signal formed and was followed by a slow uptrend. This stock market trading pattern was occurring during a time when the indexes were in a steady downtrend.
Trading Patterns, ANTP

ANTP

That slow bottoming action is the Fry Pan Bottom. It looks like the bottom of a frying pan. The psychology is simple to analyze. First, investors had a negative bias. That bias became neutral, then started slowly moving back to the upside, revealing the rebuilding of investor confidence. A conservative investor could have bought the stock after the first little Bullish Engulfing signal, knowing that the stop loss would have been any trading below the bottom of that bullish candle. A more aggressive trader would start buying as the candle formations started to enlarge, revealing that investor sentiment was dramatically building up confidence.

The result of a Fry Pan Bottom is that when it breaks out through the peak that started the downward trend, the force of the new confidence will move it to much higher levels. Does this work every time? Not every time, but the probabilities are extremely high. This is the type of knowledge that is easily obtained through Candlestick analysis. Once you understand the common sense logic of how the formation is created, the eye will become easily trained to identify this type of stock market trading pattern.
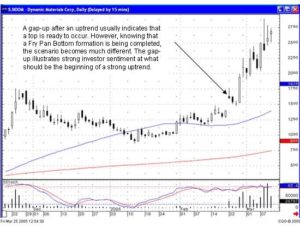
Trading Patterns, BOOM

Boom

That is why we have been so successful in trading the BOOM stock this past month. The analysis becomes much easier once the pattern of its recent past trading is identified. Being able to identify the potential chart pattern that could develop, and using other technical indicators such as the moving averages, allows the refinement of the entry and exit strategies. In this case, BOOM was first bought back in mid-January on seeing the Morning Star signal. Its lackluster movement after that signal could be credited to the 50-day moving average. Once it broke through at the end of January, the 50-day moving average acted as support. But more importantly, the slow uptrend after the slow downtrend was now giving the implications that a Fry Pan Bottom was forming.
Bear Put Spread – Bearish Options Trading Strategy

A Bear Put Spread is a stock option trading strategy employed when the market is volatile and moderately bearish. In such instances, an investor will look to make profitable trades that do not incur high risk. The Bear Put Spread method, also known as Vertical Bear Puts, is used by successful traders in such times to realize profits when the market is looking to the money of the investor.

The profit and loss strategy for a Bear Put Spread is very similar to a Bear Call Spread. The investment timing and stock market strategy for a Bear Put Spread is as follows. A trader will buy a put option on a particular stock that is out-of-the-money and will sell an out-of-the-money put on the same stock. For this method, both options should have the same expiration date. With a Bear Put Spread, the trader does not immediately realize the net premium when establishing the position as is the case with a Bear Call Spread. In a Bear Put Spread, the investor must wait until the expiration date to see any profit. While the trader doesn’t have money in hand, the profit potential is greater with a Bear Put Spread.

As noted above, the Bear Put Spread is more risky than a Bear Call Spread, but the potential for profit is greater than implanting the call spread. In a Bear Put Spread, if the stock price increases above the in-the-money (higher) put option strike price at the expiration date, then the investor has a maximum loss potential of the net debit. Conversely, the maximum profit potential involved in a Bear Put Spread occurs when the stock decreases below the out-of-the-money (lower) put option strike price. In a Bear Call Spread, the maximum profit potential is limited to the premium collected for the calls sold, less the cost of the premium paid for the calls that were purchased. Both strategies can be utilized in a bearish market, and care should be taken to understand the risk reward ratios for each strategy.

Successful trading includes such techniques as Bear Put Spreads. When an investor, through stock technical analysis, becomes aware of a bear market, it is imperative to modify his, or her, stock market trading system. A trader will find more opportunities for profitable trading in a bull market; a bear market typically requires a trader to be more conservative in order to minimize risks and find trades that, while lucrative, are less risky. A Bear Call Spread is a perfect example of such a conservative move to create profits.

stock trading plan is imperative during a bearish period of trading, and it is necessary for the investor to follow his / her plan faithfully. This requires solid stock market technical analysis, stop loss strategies, and utilization of a stock trading system such as Japanese Candlesticks. This system, which was utilized successfully for rice options trading in Japan in the 17th century, helps the investor to evaluate the data obtained through technical analysis. While a stock investing system such as Japanese Candlesticks is invaluable in any period, it is especially valuable in bearish times, since it assists the trader in drawing conclusions about the movements of the market at a time when it is most unpredictable.

A Bear Put Spread is one technique that an investor can use to make money during a bearish market or a market experiencing stock volatility. Through fundamental and technical analysis and learning how to read stock charts, a trader can focus on making money even when the market wants to take money from its investors.


Return to main Options Trading Category

Affiliate Frequently Asked Questions

Does my website need e-commerce capabilities?
No. Since all orders are processed through our site, the e-commerce is provided by us.

How do you know the orders came from my site?
The links provided to you in the Affiliates Control Panel include a unique “identifier code” which allows us to follow your sales.

Who handles customer service questions?
We do. Once your links to our site generate a sale, there is nothing left for you to do but sit back and wait for your check.

Can I receive commissions on my own purchases?
Absolutely! Place your order by beginning from the link in your site to ours and earn commissions for your own purchases.

Do I have to own a website to participate in the Candlestick Forum Affiliate Program?
Not at all! On the application page, type in www.candlestickforum.com in the Website URL.  The banners and links contain your Affiliate Code and are easily used in e-mail campaigns. If you are unfamiliar with the process to promote Affiliate sales without a website, contact our office for assistance. Toll free – 1-866-251-4015 or email

Where should I place my links?
Anywhere you wish. Some of our Affiliates place the links on their home page, while others have them in their product or shopping cart areas. You might also Add A Link to our site in your Links Directory with your Affiliate Code.

Can I use your content on my website?
You are welcome to use our product descriptions in your site. Remember our free RSS feeds are a great way to add content to your site. These articles are optimized for search engines and provide easy lead generations for your Affiliate sales.

Is there any cost to join?
None at all! That is the beauty of Affiliate Programs!

Why should I join?
For website owners, content is King, our RSS articles are a great way to build your site.
Receive cash payouts for sales by your visitors coming into our site from yours.
Get paid for products you purchase for your own personal use. That’s the same as a 25% discount off your purchase.

Why is the commission for one of Stephen Bigalow’s books not set at the same 25% commission payout?
Wiley Publisher’s restrictions prohibit us from allowing any higher payouts for this books.

Still have questions?
Feel free to contact us via our toll free phone line @866-251-4015 or email

Return to Affiliate Home Page

Calendar Spread – Neutral Options Trading Strategy

When an investor is neutral on the market, (neither bullish nor bearish) and is looking to make additional profits from his, or her, portfolio, a Calendar Spread is another way to make money investing in stock. A Calendar Spread is an option spread where the strike prices are the same, but they have different expiration dates. These spreads are also referred to as horizontal spreads or time spreads.

A Calendar Spread involves selling an option with a date that is close to expiring against the purchase of another option, of the same strike price, that has a later expiration date. This stock option trading strategy is perfect for successful traders to add profit to a portfolio by purchasing long-term options that have a reduced cost. Calendar Spreads benefit from time decay because the option sold loses value more quickly than the new one purchased. If the investor’s prediction of a neutral market is correct, the value of the Calendar Spread increases. A Calendar Spread is profitable because it capitalizes on the time value differentials when there is a neutral market.

When the option that is near term expires, several actions are possible. If the investor’s stock market technical analysis still appears to be correct, the trader can hold the long position, if sufficient time remains on it, and sell another short term option against the long position. If there is concern that the market is ready to fall, the investor can close out the long position and take the profits. If the trader is dealing in calls and the indications are for a more bullish market, he / she, can simply continue to hold the long position and realize larger profits in the future. In any case, the cost incurred buying the long position was reduced, or eliminated, by the premiums collected from the option that was sold.

If implemented successfully, the risks involved in a Calendar Spread are minimal. The potential losses are limited to the net premium paid; this is the money spent for the option that was purchased minus the money received for the near term option sold. When implementing a Calendar Spread, it is best to attempt to purchase long term options that are undervalued.

One successful trading strategy in a Calendar Spread is to buy LEAPS (Long Term Equity Anticipation Securities) because they can be purchased much cheaper than actual stock. The risk in this is that if the underlying stock goes down in price, the LEAPS lose value as well. Therefore, a trader hopes that the near term option sold expires without value, and then the investor sells more options farther out and continues to collect premiums. This way, the trader is able to reduce the cost of the LEAPS or actually realize a profit in a successful trade.

As with any stock market strategy, it is important for an investor to review the trading plan and understand the potential risks and rewards from this strategy. A Calendar Spread is an excellent way for trader to make money investing in stock.

Return to main Options Trading Category

Technical Analysis Training With Candlestick Signals

Technical analysis training is greatly simplified when incorporating the 12 major Candlestick signals. Many technical analysis training programs concentrate on specific criteria. The major benefit of Candlestick analysis is that it can be applied to any technical analysis method. Understanding the investment psychology that forms Candlestick signals dramatically improves an investors understanding of what is occurring in a trend. Being able to analyze what is happening at important support and resistance levels allows the Candlestick investor to establish positions at optimal levels.

Whether an experienced investor or just learning, applying Candlestick signals into technical analysis training takes the guesswork out of investment decisions. The information provided by the signals can create consistent profits in any trading entity. The commodity trader, Forex trader, and option trader can incorporate the Candlestick signals into their technical analysis training as easily as any stock trading program. The candlestick charts make the visualization of trend reversals very easy to see.

The Candlestick Forum will be producing an extensive technical analysis training program for the options trader. The signals provide an excellent format for evaluating direction and magnitude of price movement. These two factors, when correctly analyzed, provide the opportunity to make extensive profits in the options market.

The Candlestick Forum option technical analysis training will involve analyzing the correct option strategy based on the potential magnitude of a move during particular time constraints, expiration dates. Having the ability to project direction is a major stumbling block in most investment programs. The Candlestick signals greatly alleviate that problem.

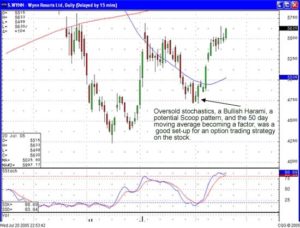
Being able to use the Candlestick signals to analyze the WYNN chart at the beginning of July made for a very compelling option trade. The Bullish Harami on the first day of July demonstrated that the selling had stopped. The following day showed confirmation buying. The 50 day moving average came into play. Additionally, the potential for a Scoop pattern to develop could be observed.

Technical Analysis Training with Candlesticks, Wynn

Wynn

Putting these factors into our technical analysis training provided an optimal option trading strategy. One strategy involved buying the July and August 50 calls. The premiums were relatively low due to a lack of great amounts of positive investor sentiment. The stop loss target was simple, the low of the last day of June’s trading.

The combination of buying calls and selling puts provided a highly profitable trade scenario. Put premiums were still relatively high because investor sentiment had not turned positive for most investors. The Candlestick signals revealed that potential. Opportunities to double, triple, quadruple profit returns become reasonably obtainable when incorporating simple Candlestick analysis techniques. Watch for additional option trading strategy information being put forth in the members stock pick commentary.

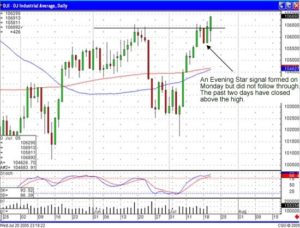
Market Direction – The markets had an opportunity to sell off early in the week. The Dow formed an Evening Star signal which was negated the next day, no selling confirmation. The past two days have shown closes above the recent peak of mid-June. Stochastics still maintain an upward direction indicating that the uptrend may persist.

Technical Analysis Training with Candlesticks, Dow

DOW

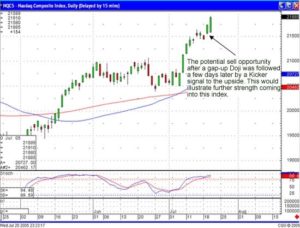
The NASDAQ also had the opportunity to create some “sell” signals but negated the selling with a Kicker signal to the upside on Tuesday. Although the stochastics are in an overbought area, the buying has shown good strength.

Technical Analysis Training with Candlesticks, NASDAQ

NASDAQ

Crude Oil prices appear to be weakening, the Bearish Engulfing signal of two weeks ago is still in effect. The 50 day moving average could be a support level but that implies at least a few more days of weaker Crude Oil prices. This, occurring at the same time that interest rates appear to be remaining relatively stable, produces a positive scenario for the economy. Interest rates remaining low and oil prices appearing to be backing off could lead to more confidence in the equity markets.
 

Trading Journal

The most successful stock traders keep a trading journal, they have a stock trading plan, and they constantly document their trades in their journal. Not only do they keep this journal, but they know what information they must document in the journal and they do it every time they trade. They keep a thorough and detailed record of every trade and the information below in order to grow as a trader and to prevent themselves from making recurring mistakes when trading stock.

  1. Numbers – Keep a trading journal that contains information on your key markets. Donft just read stock charts but write down the highs, lows, close, and volume of those markets that you follow as well as your most important technical indicators. This will keep you in tune with the markets.
  2. Record Every Trade – As stated above you must record every trade you make, not just when you feel like it!
  3. Record your Feelings and your Thoughts – In order to fully comprehend why you performed a specific action when you place a trade, you must document how you felt when you placed the trade as well as your though process that occurred. The psychology of investing tells us that you must not only understand the technical aspects of stock trading, but you must also understand the emotional aspects as well. Thoughts and feelings shape your behavior so it makes sense that you would want to document these things as you place a trade.
  4. Document your Strengths and Weaknesses – You must document in your trading journal, your strengths and your weaknesses so that you know what you are good at what you need to work on. You will always have things that you need to improve upon when you trade stock, and the hard work is never over.
  5. Develop a Trading Plan – You must have a trading plan before you even begin trading in the stock market, and you must also document as part of your trading plan, how you will work to overcome your weaknesses. Just identifying your weaknesses is not enough; you need to implement an action plan as to how specifically you will overcome your limitations. Focus on your strengths to help you do this.
  6. Track Performance – You must track your performance in your trading journal. Your personal data will show you not only your progress but again, where you have the need to improve. Track your wins vs. your losses and ensure that you are winning overall. If you are losing overall, then you will need to take a step back and reevaluate your trading plan and trading strategies.
  7. Journal Everyday – You must document in your journal every single day you trade. Go back and review and analyze what you have written. It does not do you any good to write it all down if you never revisit it. Use your journal in part as a workbook to improve your trading. You will be amazed at how much you learn from yourself!

Remember, you are only as good as you make yourself. Have a trading plan, document your trades, and trade with discipline and you should reach your true trading potential.


Market Direction

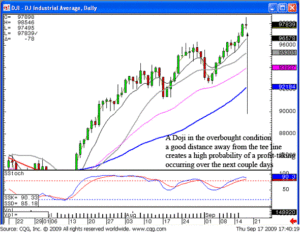
Both the Dow and the NASDAQ formed a Doji in today’s trading. This does not necessarily mean the uptrend has come to an end. However, the advantages a candlestick investor derives from knowing what a Doji represents allows for the preparation of the next days trading strategy. The uptrend is still in progress. However, a Doji has formed in the overbought conditions. Positive trading on the open tomorrow would indicate the uptrend remains in progress. Weakness on tomorrow’s open would demonstrate today’s indecision has now produced a high probability scenario for a profit-taking pullback.

Trading Journal, DOW

DOW

As we have seen in this recent uptrend, the pullbacks have been very short-lived. Either a two or three day pullback was followed by the next bullish uptrend. In most cases, the profit-taking ended very quickly. This created a decision making process. Was this the time to take profits or was this just a pullback during an uptrend? If the uptrend continues to look as if it is the predominant analytical factor but there appears to be a reversal, maybe profit taking, should I sell a profitable position and be prepared to buy it back if the uptrend continues? This is a question most investors have to face. But there is another solution.

Option trading is usually considered for  trying to make large, leveraged profits from a price move. They can also be used effectively for protecting profits. The use of candlestick signals allows an investor to analyze when a price reversal should be occurring. The price reversal could be merely profit taking or it “could” be the beginning of a major reversal. Not knowing which it could be, there are some very simple options strategies that can be put into place.

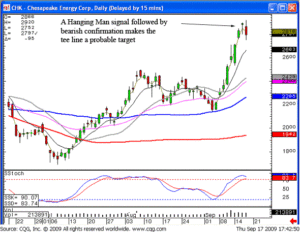
Option strategies are merely a tool that exploits the information found in candlestick signals and patterns. As illustrated in our recent recommendations of Chesapeake Energy Corp., The Hanging Man signal, followed by selling, produces an extremely high probability situation that a pullback in price is about to occur. Strong price move has ramifications. It could be the pre-requisite for a Jay hook pattern. The price could come down and test the T-line. A bounce up from the tee line would indicate the Jay hook pattern was in progress. Or this could be the top of an uptrend and a major reversal has occurred. What options strategies would be beneficial under these circumstances?

Trading Journal, CHK

CHK

If the market opens weaker tomorrow, and it is easily visualized that a Hanging Man signal was confirmed in today’s trading, what would be the logical conclusion? Probably CHK would selloff. Would it support on the tee line? That we do not know. A strategy for a one-day option trade could be to buy a September 28 put for $.40. If the market sold off hard tomorrow, testing the tee line at approximately the $26.85 level, holding the stock would have lost approximately $1.15. Buying the September 28 put for $.40 in the morning may now have moved to $1.15 when the price did test the tee line. At that time, what is the important factor we are looking for at that level? Whether the price held the tee line or not.

If the price moves down to the T-line, the put trade is closed. A 70 cent gain in the option offsets the $1.15 loss of the stock. At this point, a better decision making process can be made. If the price closes near the tee line, what should be watched for the next day? Whether the price holds the tee line or not. That decision can be made without a major move to get to that level. The $.40 was insurance to offset a price move. That has occurred on the previous trading day utilizing a put to help offset the loss required to get to the tee line.

Candlestick analysis utilizes options strategies to exploit large profits out of the market or protect existing profits. The Candlestick Forum will be presenting a Two day option trading program on September 26 and 27th. Click here for details. Option trading strategies are very simple. It is knowing how to apply those simple strategies with the correct candlestick analysis that will greatly improve option trading returns. Have you ever wondered why some people have had to spend thousands upon thousands of dollars to learn sophisticated option strategies that don’t seem to work? Then they have to go back and spend more money to learn why they are not making money with option strategies? That does not need to be done! Candlestick analysis is merely the graphic analysis of what investor sentiment is doing. That is the most important aspect of a successful trade. Once you have learned that, utilizing simple option trading strategies will produce very large profits without spending mega-thousands to learn how to do it.

Chat session tonight at 8 p.m. ET – we will be looking at a few very simple but effective options strategies in conjunction with candlestick analysis.

Good investing,

The Candlestick Trading Team


This Week’s Special

Last week to Save 50% OFF Options Trading Course

Click here for details

Annual Membership Special – Receive an Extra Month + Bonus

Click here for details

Website special reflects current newsletter. If you are reading an archived newsletter you will be directed to Current Website Special.