Archives for November 2019

Online Futures Trading – Getting Your Start With Paper Trading

In sports the saying is that you only play as good as you practice. In other words, if you don’t work hard learning to do something well you will never do it well when the game begins. The same is true when it comes to investing; if you don’t learn the concepts of successful trading before you start investing, you are in danger of losing a lot of money very fast. Thanks to the wonderful world of computers, you can prepare for online futures trading by paper trading.

What is Paper Trading?

At this moment you probably understand online futures trading, but paper trading may be strange to you. Paper trading is a method of online futures trading where you can practice investing in the stock market with a hypothetical brokerage account. Everything about this type of online futures trading is the same as the real thing but with paper trading, you lose nothing. If you make a bad purchase when you are paper trading, it is recorded in your “account” but since you didn’t actually do any online futures trading, you didn’t lose any real money.

What is Online Futures Trading?

Online futures trading is different from trading common stocks or bonds since you don’t actually take possession of anything. In online futures trading, you are speculating on the future direction of a commodity’s price that you are trading on the Internet. It is kind of like placing a bet on which way a price will move. “Buy” and “sell” are terms that indicate the direction you expect future prices will take. You only need to deposit enough money with a brokerage firm to insure that you will be able to pay the losses if your trades lose money; take a good look at the words “pay the losses”. When paper trading futures, you are immune from those dirty words!

Online futures trading offers a form of price protection for those who are trading and investing. A farmer may sell corn futures on his crop if he thinks the price will go down before the harvest; conversely, a cereal manufacturer may buy futures if they think the price of wheat is going to rise before the harvest. Regardless of the price movement, both are guaranteed their price. The other person in the deal is the investor who never sees the trading floor, but is doing online futures trading and looking to gain advantages by buying or selling futures at a profit.

Getting Started with Online Futures Trading

There are quite a few companies on the Internet that offer free paper trading; a simple Google search will give you more choices that you can imagine. These companies offer this service in hopes that after you get comfortable with online futures trading, you will open a commodity account with them. In the meantime, once you have registered, simply follow the directions of the commodity trading software and you are ready to begin.

What You Might Notice

If you decide to get started without learning anything about online futures trading, you will be in for a surprise. The language of futures trading is different. There is terminology you need to learn, strategies that you won’t understand and even the trading software will probably be confusing. It’s kind of like assembling a child’s bike; before you start, read the directions.  Before you try to start commodities trading, learn the terms, learning the techniques and learn the software where you are online futures trading.

Is paper trading futures important?

By itself, paper trading futures is not important; it just simulates the things required for online futures trading. What is important while paper trading futures is the approach you take; if you take this lightly or don’t understand the importance of learning futures trading, you should seriously reconsider ever entering the futures markets. This is a skill to learn and not doing so means losing your money so don’t take your paper trading or your online futures trading lightly.

Conclusion

Online futures trading is a unique business opportunity where you can practice and learn for free. A successful trader will use the opportunity to practice investing before trying online futures investing.
Gain Stock Investment Perspective

There are a number of usually successful ways to gain stock investment perspective. Unfortunately, some of them involve losing all of your money in bad stock investing. While experience is the great teacher it is preferable to gain stock investment perspective from traders and investors with years of experience through online training webinars such as the Candlestick Forum Boot Camp. The necessary experience for someone beginning investing in the stock market is to learn from the experience of others in order to shape a successful investment strategy. There are always profitable trades to be made and with a little homework one can always find a stock with a low price to earnings ratio and a substantial margin of safety. Learning how to find intrinsic stock value takes a little time and experience. Learning how to plan a strategy and use historically successful technical analysis tools such as Candlestick charting techniques is an excellent and profitable way to gain stock investment perspective.

Successful stock investing requires that the individual be able to carry out fundamental analysis of stocks in order to be picking stocks with either the prospect of long term growth or the likelihood of a rapid change in stock price, either up or down. Those who gain stock investment perspective over time come to realize that, although knowing the fundamentals is necessary, everyone knows or has access to the same information. However, not everyone interprets the information in the same way. Thus stock prices move up and down as investors and traders buy stock, sell stock, purchase options on stocks, and practice hedging with complicated trading strategies.

In all of this buying, selling, and hedging of stocks a stock price moves up and down in patterns. It is the patterns that are the key to how Candlestick analysis works. Although, in theory, a person could gain stock investment perspective comparable to that contained in the Candlestick signals it would probably take a lifetime of trading in the stock market. That is not necessary because an easily understood system made for anticipating stock price movement is already in place in Candlestick patterns. Another useful type of perspective that a trader can gain in an interactive online trading course is that you don’t have to trade unless you are ready. Sometimes the market is not showing you a clear Candlestick pattern.

An experienced trader will be able to recall instances of when just waiting a day or even a few minutes made market direction, as read through Candlestick charting, crystal clear and eminently profitable. By listening to experienced traders and asking questions it is possible to gain stock investment perspective just as through the beginning trader had lived and traded through the same situations. Stock trading can be a very profitable lifetime occupation. It takes time, dedication, and discipline in executing trades as part of a well devised trading strategy. Learning Candlestick basics is an excellent way to start on the way and gain stock investment experience through profitable stock trades.


Market Direction

Candlestick signals are just as important for identifying reversals in trends as they are for identifying the continuation of an existing trend. Evaluating the existence of a current trend might not appear to be very important. However, this knowledge provides extremely profitable ramifications. Candlestick chart patterns perform successfully when there is not a severe alteration of a current trend. Obviously, bullish results are more apt to occur in a bullish trend. Fortunately, this is not always the case. An identifiable sideways moving market will also permit a candlestick pattern to perform properly.

Price movements occur based upon investor sentiment. Price trends are a function of consistent investor sentiment. Price patterns are developed because of specific set of circumstances that creates a recognizable reoccurring pattern. It is when market trends and price patterns work in a consistent atmosphere that big profits can be extracted from a pattern breakout. There are no secret formulas in candlestick analysis. It is merely the visual identification of price movements that have worked multitude of times in the past.

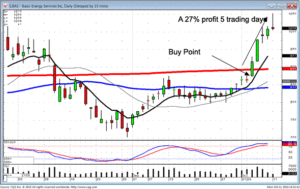
As we have illustrated in the BAS chart in recent newsletters, the expected results occurred after identifying the frypan bottom formation. Remaining consistently profitable with candlestick analysis simply requires identifying any dramatic changes, or the lack thereof, in the market trends. Why is candlestick analysis so simple to use? Because if a pattern can be identified, knowing that it will produce high profits, as seen in the BAS chart, then it becomes a very simple matter of finding the same chart pattern just starting  under the same conditions. The breakout from the Fry Pan Bottom pattern is expected to produce big profits.

Gain Stock Investment Perspective, BAS

BAS

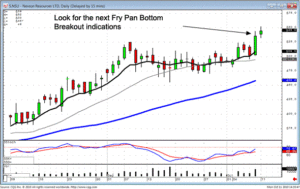
If that is the case, then it is prudent to scan for the next Fry Pan Bottom pattern that is just breaking out. The NSU chart reveals a frypan bottom with the exuberance just starting to show itself. This becomes a logical place to invest funds. Because patterns produce expected results at particular points of a pattern, not only does this become highly profitable stock trades, but it produces all the elements of big profits for option trades. The timing and the magnitude make a simple call option strategy the best for exploiting explosive moves.

Gain Stock Investment Perspective, NSU

NSU

For those of you that have not participated in the Candlestick Forum Option Training Program, October 16 and 17th, please take the time to investigate the trading strategies involved with candlestick analysis. You will gain a completely different perspective on which options strategies should be placed at appropriate times. You will gain a lot of information about how the option market works and which trades are most appropriate for specific candlestick signals and pattern movements. Do not miss this opportunity to learn an investment perspective that will dramatically improve your option trading capabilities.

Chat session tonight at 8 PM ET

The Candlestick Forum Team


 Current Website Special

E-Learning Online Training Schedule

Options Training Course 

Commodity Training

Boot Camp

Website special reflects current newsletter. If you are reading an archived newsletter you will be directed to the Current Website Special.

Trading Currency Online

Trading currency online requires that you know about the basics involving the currency market, also known as the forex market. In today’s article we discuss general concepts that you must know and understand before you commit to trading currency in order to make a profit.

This market is different from other markets. For starters, currency trading does not occur on a regulated exchange like the trading of futures, or trading stocks or options. There is no central governing body and all forex traders practice trading currency online based upon credit agreements. The currency market is however the most liquid and the largest market in the world.

The FX market does not have commissions that are paid to brokers like in the stock market. The actual forex brokers are actually dealers and not brokers and they assume market risk by serving as a third party to the investor’s forex trade. The make their money through the bid-ask-spread. (This is explained below). This is unlike stock trading where the broker makes commissions when the customer buys and sells the financial instruments.
When you are trading currency online, you are really buying and selling nothing. There is no physical exchange of currencies and al trades exist simply as a computer entry. These entries are netted out depending upon the market price. This FX market is purely speculative, in other words.

There are numerous currencies that are traded on the currency exchange but we will only list some of the major currencies. These major currencies are listed in currency pairs and are seven of the most liquid currency pairs in the world. The EUR/USD (Euro/dollar), the USD/JPY (dollar/Japanese yen), the GBP/USD (British pound/dollar), and the USD/CHF (dollar/Swiss franc) are the four major currency pairs. The three commodity pairs include the AUD/USD (Australian dollar/dollar), the USD/CAD (dollar/Canadian dollar), and the NZD/USD (New Zealand dollar/dollar).

It is also important to know some of the forex lingo when trading currency online. Knowing these terms will help you to adapt faster to the forex market.

Kiwi – nickname for the New Zealand dollar
Aussie – nickname for the Australian dollar
Cable, pound, sterling – alternative name for the British pound
Greenback, buck – nicknames for the U.S. dollar
Yard – a billion units
Loonie, the little dollar – nicknames for the Canadian dollar.

There is obviously a lot more to the currency market in addition to the lingo and the above information. Continue your foreign currency education and decide if trading currency is right for you.


Market Direction

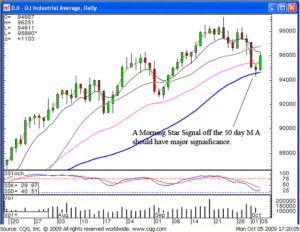
Candlestick analysis allows for the correct portfolio positioning. It also creates a clear visual playing field for adding the appropriate option trading strategies. Having the ability to recognize when a pullback might occur is important whether trading short-term or long-term. As seen in the Dow chart, the 50 day moving average had the opportunity to act as a support level. A Doji formed at that level in both the Dow and the NASDAQ last Friday. An indecisive trading day, such as a Doji, makes for a good prepared trading strategy.

Trading Currency Online, DOW

DOW

The recent downtrend called for some profit taking in long positions and setting up some short positions. It also created the opportunity to write some calls against existing positions. The benefit created by the visual clarity of candlestick signals permits an investor to apply the appropriate option trading strategy to the appropriate situation. A longer-term investor may not necessarily want to close out a position if the prospect was more upside potential after a pullback. Writing calls against that position has some low risk benefits. The makeup of a call option price is the intrinsic value of the option and/or the time premium. Holding the stock position and selling calls against the position has added benefits.

The premiums received when selling the call positions offsets the equity loss as a stock price pulled back. As the price does pullback, the price of the options diminish on a twofold basis. The intrinsic value, the actual value of the option over the strike price, will move down as the price moves lower. Additionally, the time premium will diminish also as the expiration date gets closer. This is a relatively safe strategy that adds additional income into an investors portfolio. Simple options strategies provide a tremendous source of income when the right trading strategy is applied to the correct price move. These simple trading techniques will be demonstrated thoroughly during the Candlestick Forum Option Trading program on October 17 and 18th. If you would like to learn how to dramatically increase your income while at the same time reducing your risk, take advantage of the trading knowledge that has been applied to over 20 years of candlestick application. Click here for more information

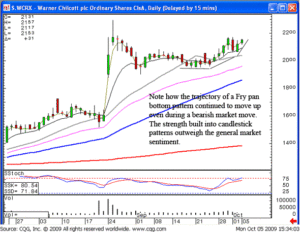
When the markets have strong pullbacks, it makes identifying the strong potential price moves much more pronounced. As illustrated in the recent recommendation of WCRX, the Fry Pan Bottom pattern was consistently showing strength during a time when the market was in an observed  downtrend. The visual aspects of candlestick analysis reduces the reliance upon technical methods that do not necessarily prove profitable. For example, “relative strength indexing” can be used to identify strong stocks in market trends, but the visual aspects of candlestick signals/patterns reveal the relative strength as well as high profit potential breakout situations.

Trading Currency Online, WCRX

WCRX

Each aspect of candlestick analysis allows for the fine-tuning of the probabilities. The elements of investor sentiment put into a graphic depiction makes investment decisions, whether buying or selling, done with much more conviction. Applying that information to basic investment rules dramatically improves an investors mental perception. It is extremely beneficial to understand the implications of the candlestick signals and patterns. When you add that on top of the viable trading rules and procedures, you get much closer to being a professional investor versus a part-time hit or miss trader.

Tonight, the Candlestick Forum will be presenting Tina Logan as a guest speaker. Her presentations and educational material provides a common sense and logical trading platform. It is advisable to learn a number of investing perspectives and then apply what is most useful for your own trading nature. Join us tonight at 8 p.m. ET, the session is open to everybody. Click here for instructions.

Good investing,

The Candlestick Forum Team


Website special reflects current newsletter. If you are reading an archived newsletter you will be directed to Current Website Special.

Risk Premium

Investors will demand a risk premium when taking on an investment with a measurable possibility of failure. A common explanation of risk premium is that it is the minimum amount of return on investment that a risky investment must produce when compared to a risk free investment. The investor accepts investment risk in return for a larger possible return on investment . For those totally averse to taking on risk there is the certainty equivalent which is guaranteed return one would demand in return for taking on a risk free investment. United States T-Bills are generally considered to be risk free investments. Thus the premium that investors require for a risky investment is typically the return offered by the risky investment minus the return on a Treasury bill.

Another way of viewing the risk premium is that it is the excess rate of return demanded by investors for taking on the risk of loss. In finding profitable investments one may look to stocks with more risk than one normally accepts. In accessing risk and required risk premium in long term investing or short term trading fundamental analysis is essential. Traders will follow market sentiment with Candlestick analysis and profitably trade market volatility . However, it is a collapse of fundamentals that commonly drives a company into bankruptcy or causes a payer to default on bond payments.

Choosing a number of such stocks in a stock portfolio spreads the investment risk . Taken to a much larger scale this is the theory behind junk bond funds. Because the risk premium is large for risky bonds a well chosen group of junk bonds can often outperform higher grade bonds as the higher rate of return more than makes up for defaults in the portfolio. The risk premium for stocks is determined by the stock market as investors and traders will not buy stocks unless the risk premium outweighs the perceived degree of risk.

Risk premium is largely a concern of long term investing as day trading concerns itself with short term stock price movement. For the day trader the fundamentals that determine risk premium are factored into the stock price as soon as they are known. Using Candlestick charting techniques traders can buy stock , sell stock , and sell short profitably by accurately reading market sentiment.

Although the trader is more concerned with technical analysis with Candlestick charting than with strict fundamental analysis he still must keep in touch with the fundamentals. Fundamentals not only drive stock price directly but they drive market sentiment as the stock market news tweaks the psychology of investing and trading in the unwary. Here is where stick adherence to Candlestick patterns benefits the investor and trader. When a Candlestick signal presents itself it tells the trader or investor that a high probability exists that a stock price will react in a specified manner. The trader or investor need only put his ego aside and follow his Candlesticks to improve his chances of profit. A this time risk premium is not the issue as the centuries of market experience distilled into Japanese Candlestick signals lights the way to profits.


Market Direction

The Dow closed right on the T-line today. The NASDAQ and the S&P 500 closed just slightly above the T-line but each formed a Doji. When analyzing a situation where the close is just above the T-line, it is important to take into consideration what type of candlestick formation was created. Because the NASDAQ and the S&P 500 showed indecisive trading just above the T-line, it will still be important to see how the markets open tomorrow. A higher open would indicate the trend is moving above the T-line. A lower open will indicate the T-line area was still acting as resistance, the down trending channel will still be affecting the trend.

Chat session tonight at 8 PM ET- guest speaker -Tina Logan -one of the leading investment trainers in the nation – join us tonight as Tina will illustrate specific techniques on how to be mentally prepared for successful trading.

2-Day Candlestick Analysis Training – Once the major candlestick signals are identified and understood, applying techniques to your trading will allow for a dramatically improved correct trade ratio. This today training session provides additional insights in how the major signals can be used successfully for identifying high profit patterns, effective entry and exit strategies, the correct stop loss procedures, accurate trend analysis, utilizing moving averages, trend lines, and Fibonacci numbers to further enhance correct trade probabilities.

Additional information about how to keep your emotions out of your investment decisions will be incorporated throughout this training process. Do not miss this opportunity to assemble the knowledge of candlestick analysis into a logical and easy to understand process. Discover how to utilize the information built into candlestick signals to understand price movements that takes most experienced investors decades to perfect. Click here for training information.

Good Investing,

The Candlestick Forum Team


Current Website Special

Scanning Tchniques Quick Download

Website Special reflects current newsletter. If you are reading an archived newsletter you will be directed to Current Website Special

2018 Stock Market Holidays

   UP Arrow GREEN      
Stock Market Holiday Calendars and  FREE E-BOOK
12 SIGNALS TO MASTER ANY MARKET
WHEN YOU SIGN UP FOR OUR NEWSLETTER

2018 Stock Market Holidays Date
New Year’s Day January 1, 2018
Martin Luther King, Jr. Day January 15, 2018
Washington’s Birthday/Presidents’ Day Febuary 19, 2018
Good Friday March 30, 2018
Memorial Day May 28, 2018
Independence Day July 4, 2018
Labor Day September 3, 2018
Thanksgiving Day** November 22, 2018
Christmas December 25, 2018
**The NYSE Trading Floor closes early (1PM ET) on
Friday the day after Thanksgiving

Remember, the professional money managers often vacation around scheduled exchange holidays.
They may also close positions several days before, causing lighter volume around the stock market holidays.


Candlestick Pattern

Candlestick Pattern Reversals

A candlestick pattern is a pattern that occurs on a candlestick chart similar to a bar chart and it indicates price movements over time. These charts were developed in the 18th century by a Japanese rice trader as a tool to provide information regarding future demands of rice. The pattern is a preferable method because the visual representation of what is happening in the markets is better visually depicted on candlestick charts than on other types of charts. Japanese candlestick charts are able to display five data points as opposed to other more basic stock charts such as line and bar charts.

In today’s article we will discuss the five bullish candlestick reversal patterns as they relate to what is occurring in the markets. We will discuss the doji candlestick, the engulfing reversal pattern, the hammer reversal candlestick pattern, the piercing pattern, and the harami.

Doji

This is the first pattern that most traders learn about when studying Japanese candlestick charting. This signal represents indecision in the market and as a result, traders question the current trend. It will often cause reversals since the stock opens up, goes nowhere during the day and then closes right back up at or near the opening price.

Engulfing

When this bullish signal occurs, it means that the sellers are overwhelmed and the buyers are ready to jump back in and take control. The demand is greater than the supply, in other words. The name comes from the second day of trading stock when the second candle engulfs the body of the first candle, while closing near the top of the range.

Hammer Pattern

This candlestick pattern typically occurs after a group of stop loss orders are hit and it is then that traders show up to take hold of shares at a lower price. This signal indicates that the sellers tool control of the stock and pushed it lower than its opening price. Then at the end of the trading day, the buyers came back and closed the stock at the top of the range.

Piercing Pattern

This bottom reversal pattern has the potential to be very powerful when candlestick trading. With this pattern the sellers are in control on the first trading day. There is potential for traders to regretfully short their stock on the first day and miss the boat when prices may continue to decline even more. This is because on the second day the price gaps down but the bulls step in and dramatically turn prices around. This move almost completely negated the price decline that occurred the previous day.

Harami

This candlestick pattern should not be confused with the engulfing pattern, but it often is. On the first day the sellers are in control of their stock and then on the second day, there is only a narrow range candle that closes up for the day. Momentum often comes to a halt when this signal occurs.

When analyzing chart pattern reversals it is important to know that bearish patterns are the opposite of bullish patterns. Bearish patterns come after the rally and they signify possible reversals just like the bullish patterns do.
Continue your Japanese candlestick education and learn about bearish patterns and other important candlestick chart patterns as well!


Market Direction

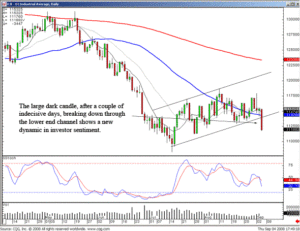
The sideways movement of the market was going to continue until there was a definite break of the trend channel. After two months of indecisive trading, today showed a breach of the lower part of the trend channel.

Candlestick Pattern, Dow

DOW

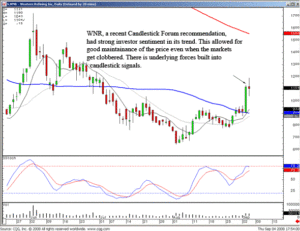
Fortunately candlestick signals reveal where recent strength is coming into sectors. This has two benefits. First, obviously is directing funds to the high potential profit areas. Second, when the markets get a big tumble as seen in today’s trading, the stocks that have exhibited strong buying will not be as severely affected to the downside. Usually strong buying interest will not reverse immediately if the market in general takes a big sudden downward move.

Candlestick Pattern, WNR

WNR

Candlestick signals provide an immense amount of information. This information can greatly improve an investor’s returns whether in a market trending in the expected direction. It also protects investment funds when unforeseen reactions occur.

Seasonal Trading – September 11, Best Choice software will be demonstrating how their software program identifies the areas that will act well during specific times of the year. Adding Candlestick analysis makes for a powerful investment combination.

Click here for instructions.

If you already have HotComm installed, click here to connect.

Good investing,

The Candlestick Forum Team

Website special reflects current newsletter. If you are reading an archived newsletter you will be directed to Current Website Special.

Best Penny Stocks

When trying to find the best penny stocks to invest in it is important first to understand just what exactly penny stocks are. There are multiple definitions available but the easiest one that is generally accepted is the definition that a penny stock is any stock priced under $5.00 a share. (per the SEC definition, penny stock status is determined by share price, not market capitalization or listing service.)  When you buy penny stocks, the company for that stock is valued at about $4 million dollars or less and it is typically a relatively new company with not a lot of history. Many investors feel that investing in penny stocks is a huge investment risk, but if you pick the best penny stocks, you can make a good return on investment. Picking penny stocks that are worth investing in is very hard to do and is a combination of difficult analysis and speculation. It is tricky because a really good company may not make a good investment when investing in penny stocks.

There is a lot of money to be made when penny stock investing, but it necessary to have expert knowledge of what to buy, how to buy, and to do the required research. The most important thing that you can do in order to pick the best penny stocks is to work on getting leads from professionals, and then look into and research those companies yourself. The point and the advantage to investing in penny stocks is the ability to turn a small investment into a fortune. The list of penny stocks available to investors typically contains a list of many young companies that start out as penny stocks and then eventually climb out of that status. Many companies will wait to go public until their stock is worth more than the penny stock range with the determination to be traded on the public stock exchanges.

The best penny stocks have a consistently high volume of shares that are traded therefore providing an acceptable rate of return. It is very important however to be cautious because it is possible to skew the results of average volume trading. There are those bad investors who look for quick opportunities to make money so you must be sure that you understand the game. In order to be successful when investing in stock of this nature is to ensure that someone isn’t just trying to push you to buy stock so that they can quickly sell and run away with your money. Another downside to investing in penny stocks is the volatility of shares and the lack of corporate transparency. It is very important when looking for penny stocks that you do not buy them from consumers who use high-pressure sales tactics or from anyone that guarantees you a return. There are no guarantees in this online stock trading game!

Remember, selecting the best penny stocks is not a skill that you can develop overnight. It takes years of experience and research before you can make a significant income. It is wise to not only study how to buy penny stocks but also to develop a network of peers. You will learn faster through developing relationships with other penny stock investors who have been through the trenches. You can do this by joining online forums or investments clubs. Your peers can offer you investment advice based on their experience and may save your from making the same mistakes that they did.

Understanding Fibonacci Indicators in Technical Analysis

Since stocks have a greater tendency to retrace, rather than move in a straight direction, traders use the Fibonacci Indicators as reference points to predict a retracement versus a reversal. Extremely accurate when analyzing chart pattern reversals. Fibonacci indicators also provide an excellent visual map. Combined with Candlestick Signals, the savvy trader can find optimum entry and exit points.

An effective Candlestick trading tactic is to  look for small double bottoms or double tops within these lines to identify trading opportunities. Congestion can form around the 38% and 62% levels, so watching for Candlestick Breakout signals at these levels can forewarn of significant price moves. Just like moving averages, the Fibonacci indicators work like price magnets to old highs or lows. For an even greater degree of accuracy they should be combined with the major japanese candlestick patterns.

Most common numbers used in technical analysis for drawing Fibonacci lines are 62% (61.8% rounded up), 38% and 50%. For existing trends, the 38% level should be the minimum retracement but can go down as low as the 62% level. As price retraces, support and resistance occurs at a high rate near the Fibonacci levels. In an existing rising trend, the retracement lines descend from 100% to 0%. In an existing downtrend, the retracement lines ascend from 0% to 100%.

Technical Analysts use these Fibonacci Indicators  (Fib-lines) to predict Price Targets and Support/Resistance Targets. To accurately draw the lines to identify these patterns you begin drawing from the lowest point (which equals your 0 percent line) to the highest point (which equals your 100% line). The 38%, 50%, and 62% lines will provide your reference point for targets.

While nothing can predict the future with 100% accuracy, adding these to your technical analysis tools  greatly enhances your ability to be in profitable trades. Adding the candlestick signals provide a huge advantage for being able to immediately recognize what is going on in investor sentiment at these levels. Don’t force the picture; should you come across a chart where the Fib-lines conflict with your other technical indicators (such as moving averages), move on to another chart. There will be plenty of charts providing greater confirmation when all your technical indicators are in agreement. (More about our newly released 30-minute training tutorial Fibonacci Trading Techniques)

Finding Stock Entry Signals with Japanese Candlesticks

Learning the psychology behind accurate stock entry signals will truly alter your investment aptitude. You will start looking for “buy” signals in oversold stocks. You will start anticipating when to take profits in overbought stock positions. Remember, you are not being shown “secrets” of the investment world. You will be learning a trading program concept that will educate you on how the common investor thinks, then turn that thinking into huge profits. And you will learn how to do it without having to experience all the learning bumps that I did.

Coming around full circle, thinking what I would be thinking if I was reading all of this, is the same question that I would pose to all the other magnificently sounding investment programs that are on the market, “If this trading program is so great, why are you exposing it to everybody else?”

The One Major Drawback to Japanese Candlesticks.

Through the years it became apparent to me that the Candlestick trading signals were truly profitable trading indicators. So accurate that this system should be catching on like wildfire. However, the more I became convinced that the Candlestick methodology outperformed all other technical methods, the more I was surprised that very few people knew about its benefits. Very few. It was hard to find anybody who could intelligently converse about the signals. I can count on one hand the number of people that I could talk Candlestick trading with over the past ten years. And most of them had published books on the subject. The problem was that there was nobody to analyze my analysis, to confirm or reject what I saw in a signal formation. Essentially nobody knew how the Candlesticks worked and how positively effective they were.

It became apparent that this lack of knowledge would be detrimental in trying to establish a hedge fund using the Japanese Candlestick trading method. Convincing investors to invest in a fund that produces extraordinary returns, using Japanese Candlesticks, not a sophisticated sounding trading method, would be an uphill battle if trying to market to an uninformed public.

The truth of the matter is that teaching thousands of investors to utilize Candlestick investing will never affect any investments that the Candlestick Forum would be participating in. Each investor has their own specific areas of investment interest. Large cap stocks, bonds, grains, currencies, meats, options, and dozens of other investment vehicles will be the object of their investments. Even thousands of new Candlestick investors out in the investment arena would be a drop in the bucket compared to the many millions of investors in the world.

Take advantage of this candlestick investing knowledge. It will not take weeks or months to verify whether the signals work. They will prove themselves instantly. If you always keep in mind that the signals are the result of a change in investor sentiment, your road to extracting great amounts of profits from the markets will occur very quickly.

Effective Stock Market Trading System – Candlesticks!

Most investors do not have a stock market trading system. Unfortunately, that is usually a natural evolution of learning how to invest. We become educated, we develop a career, we earn money and then we have to figure out how to invest our money. There is no educational institution that will show us how to invest or even set up a stock market trading system. We usually learn by the seat of our pants. But the age of computer is changing all that. The Internet has provided the information for investors to make their own investment decisions. This is much different than how investment information was disseminated a mere decade ago. With the development of computer software, the dynamics of the investment arena has changed dramatically. An investor can develop their own stock market trading system. They have all the information that is available to every investment professional in the world right at their fingertips. Candlestick charts provide this information at a quick glance.

Candlestick analysis is just now coming into its own because of computers. Here is a stock market trading system, although a few centuries old, that is benefiting from today’s computer technology. It can be assumed that the correct trade ratio for candlesticks has to be relatively good or we would not be witnessing them today. However, they were developed without the benefit of a multitude of investment parameters that can be found on computer systems today. In the following months you will be exposed to some of the techniques from modern-day computer research that when applied to candlestick signals enhances the probabilities of being in the correct trade all that much more. This is the best of both worlds. Taking a stock market trading system that has worked for centuries and being able to tweak it constantly with improvements that are showing up every day through computer research. The Doji, forming at the 50 day moving average, is one of those patterns that has been found to greatly improve returns.


Market Direction

As mentioned in last week’s newsletter, the Long-legged Doji, forming right on the 50 day moving average, would and did become the pivotal point for the next major move in the market. The Doji forming a 50 day moving average as an important alert for a substantial move in a current trend. ( Further explanation can be seen later in this newsletter ). Friday was a bullish day. The NASDAQ had a good strong bullish Candlestick signal, a bullish day that came more than halfway up into the last large dark candle of Wednesday, after a gap down inverted hammer. The Dow had the same strong reaction. The Dow did have a good bullish day, a Bullish Harami. The question then becomes whether this is a full-fledged reversal or merely a bounce back up. However, even a bounce should be substantial enough to make some profits on the long side. The 50 day moving average now becomes a resistance target.

Common sense dictates that you try to invest in the direction of the trend on the market. Why try to swim against the current? However, keep in mind that the candlestick signals are the cumulative knowledge of everybody that was buying and selling that day in whatever trading entity or index. That point becomes quite clear in our recommendation of SUPG this week. During a time when the markets were selling off dramatically, the chart of SUPR revealed an extremely strong Candlestick buy signal. The Doji, followed by a gap-up and a strong bullish day, illustrates that the buying was coming into this stock in spite of the fact of the markets were being sold off heavily. The advantage of the candlestick signals is that it tells you exactly what the investors are doing. It can be assumed that something had to motivate the buyers to buy aggressively in SUPR when they knew the rest the market was being sold.