Archives for November 2019

Buying Futures

A means of profiting from price changes in commodities and stocks as well as stock indexes is by buying futures contracts. Unlike buying calls or buying puts in options trading, buying futures obligates traders to buy the stock or commodity on the contract settlement date. Unlike options contracts a futures contract is not executed at midpoint in the contract. However, a trader can sell in order to exit contracts on futures exchanges at any time that the futures price is profitable or any time that he wishes to eliminate the risk of holding the contract to settlement. The vast majority of those buying futures contracts will exit the contract by executing the opposite trade.

Those companies dealing in commodities will coming use buying futures and selling futures as a hedging strategy in order to guarantee a future sale or purchase price. In buying futures a trader is buying a derivative contract based upon the equity or commodity that underlies the contract. In buying futures on stocks, stock indexes, and commodities the trader assumes a long position. The price of the futures contract is determined by the market for the underlying. This price will fluctuate with current market price and expectation of the price at a date in the future. The use of technical analysis tools such as Candlestick analysis is important in reading market sentiment and anticipating price movement of both the underlying stock and the stock price as of the settlement date.

Many underlying elements of buying futures are not stocks and not really commodities either. They may be financial instruments, stock indexes, interest rates, and even such esoteric things as cap and trade futures. In each case the futures price will vary based upon underlying conditions and traders who successfully use technical analysis with Candlestick chart analysis can prosper by accurately predicting where the price or value of the underlying element will go in relation to its price when the contract is made. Although the settlement date of a futures contract may be weeks, months, or even years in the future the contract’s value or price can fluctuate by the minute as market conditions dictate. These contracts are traded on formal exchanges in set amounts with set contract settlement dates. As in all stock trading the fundamentals of the market are generally known and it is the stock price configuration that the trader reads with Candlestick chart patterns that gives profitable clues to where the stock price and stock futures price is going next.

Keys to success in buying futures are competent fundamental analysis of the underlying equity or index as well as up to the minute technical analysis with an easy to read tool such as Candlestick analysis. Knowing fundamentals gives the trader or investor a clear view of the potential of the stock market or of a given commodity such as corn futures. Knowing how to use Candlestick chart formations to anticipate future prices lets the trader profitably buy futures and sell futures whether for underlying stocks, commodities, indexes, or other, more esoteric, things such as index futures.


Market Direction

Candlestick analysis allows an investor to analyze the most basic investment decision-making tool, the market indexes. The premise of candlestick analysis is the evaluation of what investor sentiment is doing. Investor sentiment can be identified in the market in general, all the way down to the 1 min. specifics of an individual stock. Knowing the direction of the market indexes provides an extremely powerful profit force. As witnessed in the Dow during the past two days, there has been a noticeable change of investor sentiment. What had been a whipsaw market, a sideways moving market, had now been exposed as a new trend.

Buying Futures, Dow

DOW

The significant factor of the bullish candle is  that not only had a huge price move, but it closed above the top of the recent congestion area. This has significance! Everybody could see there was a resistance level and a close above that resistance level now provided new information. The Bulls were not stopping at the resistance level. That may seem very simplistic but candlestick analysis help perform analysis in as simplistic a manner as possible. Trading above a resistance level, and also above the tee line, makes for a very simple trend analysis. The trend is now in an uptrend. With that information, positioning the portfolio in the proper direction allows for the makeup of the small losses that may have occurred when the market was not showing a definite direction.

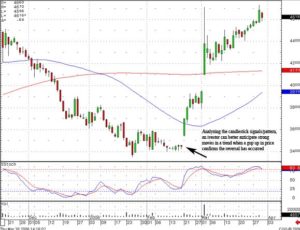
Many investors have a difficult time comprehending one aspect of investing. There will be times in the market when money will have to be at risk based upon what the candlestick signals are revealing but also will have to be closed out quickly because of a quick change in what the candlestick signals are now revealing. This comes back to the Sage advice, “Cut your losses short, let your profits run.” Using candlestick signals correctly will greatly eliminate the fear factor of looking stupid. Many investors have a difficult time closing out a position because it appears to be the time to close out the position but then witness new evidence that is time to be back in that position. Many investors take this as a personal affront. The stock does not like them! An easy way to eliminate that ill-conceived point of view is to ask one simple question. What is the chart telling me to do!

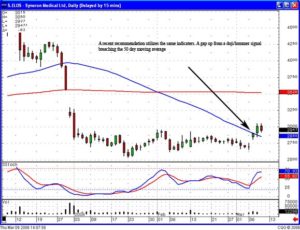
Note in the TQNT chart and the ATML chart, there was a time to close out the position, but there was also a time to immediately buyback that position. There will be times when one confirming indicator is breached but prices coming back up through the confirming indicator will now reveal other trend analysis factors as be in the predominant information.

Buying Futures, TQNT

TQNT

Buying Futures, ATML
ATML

Chat session tonight at 8 PM ET

There will be a quick dissertation on how different stop loss procedures should be applied during different market conditions.

Good Investing,

The Candlestick Forum Team


Website Specials

Eliminating Emotions

Profitable Candlestick Trading – Book 1
Candlestick Signal Flash Cards – Set 1
Major Signals Mouse Pad

High Profit Candlestick Patterns – Book 2
Candlestick Patterns Flash Card – Set 2
Major Signals Mouse Pad

FAST-TRACK TRADING
Technical Analysis Training Package

Fun Pack

1 Month Full Membership

Website special reflects current newsletter. If you are reading an archived newsletter you will be directed to the Current Website Special

Purchase Commodities

Traders will often purchase commodities because of the potential for wide commodity price variation. Especially in agricultural commodities, prices can fluctuate fifty percent or more in a year. Producers and processors of commodities will often engage in hedging commodities in order to guarantee a stable price structure for their business operations. The hedging by producers and processors of commodities provides a base market in which the trader can profit in commodities trading. In order to purchase commodities, traders will post a margin. Margin requirements to purchase commodities include the maintenance margin which is what the trader must maintain in his account in order to trade. A performance bond margin is monies deposited by both buyer and sells of commodity futures contracts to guarantee performance of the contract. This is essentially a security deposit. To purchase commodities the trader will want to track return on investment. Return on margin is typically used as a measure of success for those who purchase commodities. This is the gain or loss in trading compared to money invested. It should be noted that this is not return on money per commodity purchased or sold but return on the amount of money dedicated to the margin account in order to purchase commodity futures and sell commodity futures. To learn to effectively trade commodities a good place to start is Commodity and Futures Training.

Because of the potential for rapid changes in commodity futures price there is the potential for substantial commodity futures profits. When a trader decides to purchase commodities he or she will decide on the commodity and the delivery date. Commodity delivery dates can be next month, next year, or several years hence depending upon the commodity traded. However, the trader need not hold the commodity contract for its duration. He or she can make the opposite trade to exit the contract. That is the trader can sell the same commodity with the same delivery date. If market fundamentals change or technical factors lead to a substantial market change the trader can exit the trade with a profit long before the contract expires. Traders will follow both fundamental and technical analysis in order to profitably anticipate commodity price movement. The use of Candlestick analysis can help the trader see potentially profitable market patterns and market trends allowing them to purchase commodities and sell commodities in a timely and profitable fashion.

Candlestick basics have been around for centuries. They were developed by commodity traders in the rice market in Japan in the days of the Samurai. Just as in days past a trader can spot a Candlestick pattern indicating that the price of the commodity will likely go up or down in the very near future. Candlestick pattern formations let the market tell the trader what it will do. This is because market patterns tend to be repetitive. Reading the first part of the pattern helps predict the second part of the pattern. This can lead to handsome profits for the trader who uses Candlestick patterns to guide in the purchase of commodities.


Market Direction

What makes candlestick analysis so profitable? The Japanese Rice traders provided a format that allowed investors to anticipate what should happen next. Witnessing buy or sell signals in overbought or oversold conditions produce high probability results. As seen in the Dow chart this past week, it was evident the Bulls were starting to step into the market. The stochastics were in the oversold condition and buy signals started to appear. After Monday’s hard pull back, Tuesday formed a Doji. This made trading on Wednesday very simple. The market was going to move in the direction of how they open that after Tuesday’s Doji. This is not rocket science! This is merely applying the simple rules the Japanese Rice traders identified as high probability situations.

Purchase Commodities, Dow

DOW

Upon seeing the premarket futures trading positive on Wednesday morning, after the previous day’s Doji, and with stochastics in the oversold condition, the trading strategy became very simple. Buy immediately! While other investors may have needed further confirmation or they were not prepared to buy immediately on such a strong open, the candlestick investor could utilize the information that is built into candlestick signals. The NASDAQ had a Doji formed on Tuesday. It was gapping higher on Wednesday. This is exactly what the candlestick investor wants to see, especially in an oversold condition. Strong charts were bought immediately.

A major function for profiting from the markets is having a game plan. Candlestick signals allows an investor to be prepared for what price actions might do the next day. Where most investors were crying the blues during the market pullback throughout 2008, most of the candlestick investors on the website did moderately well when establishing positions in the short funds. Whether a fundamental investor or a technical investor, candlestick analysis provides a relatively accurate roadmap for the market direction and individual stock moves.

The same analysis is applied for trading commodities. The benefit of a commodity is that the price does not have multiple outside influences that will change the direction of a trend. Most commodities and currencies trade relatively consistent in a trend due to merely supply and demand. Whereas stocks have outside influences such as the market direction in general, interest rates, political rhetoric, or the shenanigans of company management, commodity and currency prices are usually affected by investor sentiment that is going to remain consistent for relatively long periods of time.

The member chat room is open all day long during market hours. The Monday night training sessions and the Thursday night training sessions are enhancing visual training that allows an investor to clarify in their own minds what a price movement should be doing after specific signals. The daily stock picks should not be used merely as trading vehicles. The daily stock picks and commodity pics should be analyzed to get a better understanding of why those specific recommendations were made. You should have discovered by now that the candlestick charts do not overwhelm you with multitudes of technical indicators. The signals themselves produce an immense amount of information. When you use this information correctly, the confirming indicators allow for an evaluation that will improve the probabilities of a trade.

Chat session tonight at 8 PM ET. Everybody is welcome. Also, consider having your children start learning the concepts of investing during their learning years. That puts them in a much better position when it comes time for them to start managing their own funds.

Click here for Chat Room Instructions.

Good Investing,

The Candlestick Forum Team

Current Website Special

Moving Averages

E-Learning Online Training Schedule

Basic Stock Market Training with Candlestick Analysis

Options Training Course

Commodity Training

Boot Camp

Buying Margin

Buying “on” margin

Buying on margin is one way that investors use leverage to increase a possible return on investment. Leverage is a great way for the investor to magnify gains however it comes with great risk. While you can magnify your gains, you can also greatly magnify your losses.

In order to buy on margin, you must first open a margin account with a brokerage firm. The broker lends the investor cash in order to purchase financial securities. This is in the form of a loan and if the value of the security invested in drops then the investor is required to deposit more cash into his or her account, or to sell the stock or a portion of the stock or other financial security. Basically, when buying on margin you are investing with your broker’s money in attempts to gain more of profit than you would have otherwise gained if you used only your own money.

The initial payment made to the broker for the asset being purchased is what buying on margin refers to and this collateral is referred to as the maintenance margin. In other words, the maintenance margin is the minimum amount of equity that must be kept in the margin account to prevent from receiving a margin call. A margin call occurs when the value of the margin account decreases below the maintenance margin determined by the broker. It is the demand by the broker that the investor deposit more equity into the account or to sell off some assets. The minimum level that is required is about 25% of the total market value of the securities in the investor’s margin account. Some brokerage firms will charge percentages closer to 30 and 40 percent.

While margin buying is risky, the advantage is that you can buy up to twice as much stock as you originally could with just the cash in your margin account. This means you can potentially double your profits! The downside is that your broker can sell off your securities if the price declines. If this happens then you are unable to partake in any future rebounds that would occur if you were trading from a purely cash position.

Investors must weight the advantages and disadvantages of buying stocks on margin and decide if this is a strategy that they are comfortable with. For some investors it is too risky, however many investors utilize this leverage strategy and find it very beneficial. 


Market Direction

Why is it important to have margin capabilities or option leverage when using candlestick analysis? For the simple process of taking advantage of favorable probabilities. If you know the probabilities are in your favor every time you make a trade, you will want to have as much accessibility to purchasing power as possible. The results of candlestick signals have proven to produce a statistical favorable result throughout the centuries. Obviously, if they didn’t, we would not be studying them today.

The expected results of a price pattern or signal confirmation provides a very big advantage to the candlestick investor. It allows for the ultimate high profit/no risk trade. Let us repeat that statement, high profit/NO risk trade.


As always, when somebody tells you there is no risk in an investment transaction, it is time to run like a jack rabbit. However, if you understand how to develop a no risk transaction, you will have discovered a simple trading strategy that put all the investment information found in candlestick signals and patterns to the ultimate profitable use.
This past weekend the Candlestick Forum presented a two-day option trading program utilizing candlestick signals. It stressed the utilization of the correct option strategy to the correct trade patterns. Each trade has risk. What if the risk factor was eliminated before the trade was completed? This is done by utilizing the information conveyed by expected results of a pattern. When analyzing a price pattern and viewing the confirmation of a pattern, what happens to the probabilities? The probabilities are greatly skewed in favor of the expected results. When a trade is executed based upon that information, the risk factor is greatly diminished. The expected results makes the trade a high probability situation.

The Staggered Spread dramatically changes the dynamics of a profitable trade. It has the capabilities of dramatically decreasing and more importantly, completely eliminating risk from a transaction. This can be done by strategically executing a spread option trade. As illustrated in our recommendation today on POT, the chart pattern showed a potential breakout through a resistance level. There are two simple methods for a breakout. One can be the price moving up strong through a potential resistance level. The other is a gap up through that resistance level. A gap up through that level usually creates a strong price day.

Buying Margin, POT

POT

With that knowledge, a risk-less transaction can be put in place. This morning, POT gapped up through the resistance level. The first leg of a spread pattern was put in place on the open. Buying the November 105 calls at $2.60. selling the November 110 calls for $1.20 would ‘have made’ the net cost $1.40. $1.40 to end up as five dollars if the price of POT closes above $110 at expiration day fits in to the parameters of making a three to one return on a spread.

But there is a more profitable trade situation! Buying the November 105 calls on the gap up open for $2.60 would have opened the first half of the staggered spread. What were we expecting if the price gapped up through the resistance level? A strong price move. That anticipation would now hold the other half of the spread from being executed until the end of the day. As seen in today’s price movement, what was expected after the gap up through the resistance level did occur, a strong price move. The end of the day would now allow an investor to sell the November 60s at a much higher price. Any price above $2.60 would make this transaction riskless.
Buying the November 105 calls at $2.60 and selling the November 110 calls for $2.60 would mean there was no money exposed to this transaction. If the price closed above $110 on expiration day, the zero money transaction now would release $500 of profits for each contract.

Buying Margin, MOS

MOS

The longer the markets move in a slow consistent uptrend, the more breakouts will occur. An investor can control a large amount of equity without being exposed to any market risk. Take advantage of the information built into candlestick signals. Learn how to develop option trading strategies that will dramatically increase your equity without exposing your funds to losses.

Member Chat Session tonight at 8 p.m. ET.

Good investing,

The Candlestick Forum Team


This Week’s Special

How to Trade Gaps – 2 Video Package
Website special reflects current newsletter. If you are reading an archived newsletter you will be directed to Current Website Special.

Trading for Dummies

Trading for Dummies in the Forex Market

The forex market also known as the foreign currency exchange is one of the largest financial trading markets in the world. Forex trading involves the investment in the currency of a country. Trading for dummies tells us that businesses as well as individual investors will do this. Multinational corporations who do business across nations may keep their cash reserves in a variety of countries. Individual investors have also realized the potential for profit that can be made when trading forex as well.

Trading for dummies in the forex market also tells us that the major cities that forex trading occurs include New York, London, and Tokyo and forex trades can be placed 24 hours a day. There are of course more active hours depending on the exchange and most trades take place during those hours. Typically when the European trading ends the American trading begins and then when the American trading ends, the Asian trading begins.
Trading for dummies provides a list of terms used in the forex world. They are described below.

Bid – to buy

Ask – to sell

Trading volume – the amount that is traded

Liquidity – the financial ease of transaction

OTC – over the counter (see also over the counter stocks)

Exchange rate – the difference between the value of one countries currency and another’s

Bid/ask spread – the difference between the proposed buying price and the actual selling price.

Central bank – the national bank of a nation that typically exerts control over the value of that currency.

Hedge funds – large mutual fund companies that determine the value of a currency through speculation and that control large amounts of money.

Also, it is interesting to note that most actively traded currency is the U.S. dollar that is about 90% of all trades! Next is the Euro, followed by the Japanese yen and the British pound.

Trading for dummies in the currency market also tells us the most commonly traded currencies. These include the U.S. dollar, the British pound sterling, the Australian dollar, the European Euro, and the Japanese yen, among some others. This market contains many small forex markets that specialize in trading various foreign currencies and the values depend on that market in which the investor is speculating. As a result there is not unified rate, but rather multiple rates that vary depending on where the trade occurs.

There is a lot more to trading currency and it is a great way to make money. Continue to study trading for dummies in the forex market and learn to find out if forex currency trading is an option for you.


Market Direction

Many investors think investing is difficult. This is a function of the so-called professionals creating that impression. It is not difficult for them to do so because most investment advisors know little about how to predict the direction of markets. They get their training in developing a safe and balanced portfolio that will not devastate an investor’s estate. Their  investment philosophy incorporates the simple investment process of buying a quality company and holding it for the long term. Over an  extensive long run, this investment program has worked. But it has worked for everybody!!! Why would you need a professional money manager to put you into a situation that is going to work no matter what. What is the risk of a long-term investing program? If your investment advisor recommends buying XYZ because it has good fundamentals and good management, it should be expected to go up over time. That is one advisors/analytical team’s research prognosis. What is the risk? The position not going up or even going down while you’re holding it for an extensive period of time. You have lost money and the opportunity to make money with those funds.

Why does candlestick analysis eliminate  risk? The signals and patterns demonstrate what investor sentiment is doing right now. You do not have to wait an extensive long period of time to see whether a stock price is going to go up. The signals demonstrate there is a high probability that price should be moving immediately. Investing should not be complicated. Investing for dummies implies there is a simple way to make money as well as a much more sophisticated method to make money. The truth is that investing should be kept as simple as possible. Will Rogers had a very simple investment philosophy. “Buy stocks that are going up. If they don’t go up, don’t buy them.” Obviously this brings a chuckle. But in reality, candlestick analysis is as  close to that philosophy as possible. What stocks do we want to be buying today? The stocks that show good indications they are going up. Not stocks that might go up next month or next year, the stocks that have candlestick signals that illustrate investor sentiment is turning positive now.

If you are concerned that investing is too complicated for you, don’t be! Candlestick analysis is merely a simple graphic depiction of what is occurring in investor sentiment. Candlestick analysis is implemented with common sense assessments. The information built into candlestick signals can be easily interpreted by the beginning investor as well as the seasoned trader. Investors lose money mainly due to  emotional decision-making. The simple rules of candlestick’s dramatically reduces that investor flaw. As can be seen in this uptrend since early March, there have been many time frames of indecisive trading, two days up, two days down. This past week has been one day off followed by one day down. This could make an investor awfully nervous, closing out positions when they shouldn’t or establishing long positions when they shouldn’t. There is one factor that can be observed during this uptrend. The sellers could not produce a candlestick sell signal confirmed with a close below the tee line. Knowing that simple rule for candlestick investing allows an investor to sit much more comfortably with positions without getting whipsawed.

Trading for Dummies NASDAQ

NASDAQ

The uptrend is still in progress. The longer the uptrend remains in progress, the more investor confidence will build up. Currently there is not a sell signal. With the trend remaining above the tee line, it can be comfortably assumed the uptrend is still in progress. That provides the opportunity to take advantage of high profit patterns that are developing. You do not have to understand how to analyze a corporate balance sheet, how crude oil prices, gold prices, interest rates, or the US dollar may affect the stock market. You do not have to understand what the TARP money will do to the banking industry. All the analysis that has been done by full-time analysts can be seen in the results of the candlestick singles and formations. Candlestick analysis is the study of what everybody else has decided from their research. Do not make investing difficult. Learn how to take advantage of the knowledge built into the signals.

The longer the uptrend continues, the more profits are being made coming out of patterns. The Fry Pan Bottom pattern has produced numerous big profit trades, 40%, 60%, 80% and greater profits. The J-hook pattern has created huge gains during the slow study of trends in the market. The advantage of trading the patterns is the expected results. A pattern will produce a price move inordinately stronger than the trends of the market. As witnessed in the FITB chart, a breakout from a Fry Pan Bottom pattern started producing a big price move exactly when expected.

Commodity Trading Online, FITB

FITB

Option traders

The same scenario for option trading is just as pertinent as investing itself. It should not be difficult. The Candlestick Forum will be providing an Option Trading program in the next few weeks. You will not have to learn about the Condor, Delta, beta, horizontal spreads, or many other terms that are applied to option trading. Trading options should be a process just like investing, keep it as simple as possible. Huge profits can be made when you know how to apply the correct trade strategy to the correct price move. Investing becomes much easier when you have a simple format to follow. If you already know what to expect from a trade, the emotional decision-making process is completely eliminated. If you do not know the 12 major signals and the High Profit Patterns, please take the time to learn them over the next few weeks. Implementing option strategies using the signals and the patterns is merely putting the probabilities in your favor and leveraging the potential profits. Take advantage of this week’s specials on the 12 major signals and the High Profit candlestick patterns.Click here for details.

Timing is a very important element for successful stock trading. It is even more important when it comes to option trading. Because the candlestick signals and patterns have expected results, the timing of trades is much better refined. Correct anticipation  provides a much better profit tool when knowing the expected results. As seen in the FITB chart, the Fry Pan Bottom breakout at the five dollar area would have led to a profitable stock trade. However, the percentage gain would have been greatly multiplied through an option trade. This is not rocket science. This is merely taking advantage of the information has worked consistently through the centuries when applying candlestick analysis to trading.

Members Chat Session tonight at 8 PM ET.

Good investing,

The Candlestick Forum Team


This Week’s Special

Website special reflects current newsletter. If you are reading an archived newsletter you will be directed to Current Website Special.

Earning Stock Trading Profits with Candlestick Signals

Earning stock trading profits with Candlestick signals is something that traders beginning investing in the stock market can do with proper training and practice. A good place to start training to learn Candlestick analysis is at a Candlestick Forum Boot Camp. A good place to practice is at a trade station in simulation stock trading followed by online coaching during trading sessions. Earning stock trading profits with Candlestick signals is what traders have done for years. In fact, Candlestick charting techniques go back hundreds of years to commodity trading in rice in Japan. Because Candlestick patterns can be seen any market it is possible to use Candlestick trading tactics when trading options, trading futures, and trading commodities as well as trading stocks.

After initial training, earning stock trading profits with Candlestick signals is a matter of applying what the trader knows. Traders need to choose which stocks to trade and the method by which to trade them. Trading stocks directly is possible as well as trading stock indexes and trading stock options. In any case traders will use Candlestick chart formations to predict future movement of stock prices as it is the stock price that matters even in index trading and options trading. Often times the choice of stocks or indexes to trades is as important to earning stock trading profits with Candlestick signals as trading technique. This is because some stocks have such little price variation that there is little profit to be made. In looking for stocks to trade it is important to look for price fluctuation and volatility. It is in trading volatility such as a breakout gap where trading profits can multiply for the trader skilled in Candlestick trading.

Earning stock trading profits with Candlestick signals is possible because price patterns in markets repeat themselves. Although these price patterns are based upon fundamental factors the technical trader knows that the fundamental factors are generally known. As the market reacts to the fundamentals traders will find a Candlestick pattern that reliably predicts the next market move. At that point all of the training in simulation and all of the online training webinars come to fruition as the trader will buy stock or short sell stock as dictated by a Candlestick pattern. Profits come when they are ready and one of the reliable ways to know if the market is going to change is by learning and using Candlesticks.

Earning stock trading profits with Candlestick signals also has to do with avoiding losses. Managing investment risk comes into play in all successful stock trading. By learning to accurately identify as well as interpret strong Candlestick signals the trader will learn to stay out of trades where the signals are weak or even unclear. There is always time to trade and stock to pick for trading. A large part of the wisdom of trading with Candlesticks is to identify when earning stock trading profits with Candlestick signals is likely and when what you see on the stock chart is only a semblance of a signal and not the real thing.


Market Direction

Candlestick analysis is not merely identifying when a reversal signal occurs. It also involves analyzing potential change of investor sentiment at the appropriate conditions of a trend. This allows an investor to be prepared for repositioning a portfolio by anticipating when a signal should appear. As seen in the Dow on Tuesday, it sold off hard and closed below the T-line. The dark candle did not form a reversal signal. However, the magnitude of the selling and the fact that a close below the tee line provided valuable information. This may have been the first crack in the confidence of the Bulls during a nice steady uptrend. Wednesday.most of Tuesday’s losses back. Today’s early-morning buying was showing more bullish sentiment but needed additional confirmation. The bullish sentiment needed to stay in the markets today, indicating the Bulls were solidly in control. As pointed out in the morning comments, a close at the lower end of the range would raise suspicions the Bulls were becoming more nervous.

Today’s close clearly revealed the investor sentiment. Indecision! The Dow and the NASDAQ finished the day as a Spinning Top. The underlying factor remains that the indexes did not close below the tee line. The market uptrend still has to be considered to be in progress. There is now evidence the bears are coming into the market. There are strong bullish charts continuing and there are some good short positions setting up. This may be another indication the investor sentiment is starting to switch over.

 Earning Stock Trading Profits, DOW

DOW

The same evidence that is used to show when a trend might be losing steam can also be applied to identifying the strength of a trend coming out of a candlestick pattern. As seen in the TPC chart, the fry pan bottom was followed by a breakout and produced the expected uptrend. Note how indecisive trading over the past few days in the market has not altered the strength of this trend. This reiterates the point that a pattern price move is usually going to continue based upon the force built into the pattern versus what the rest of the market conditions are doing.

Earning Stock Trading Profits, TPC

TPC

Learning how to use candlestick signals and patterns effectively involves knowing what a price move should do after specific circumstances. The alternative is knowing what the signals and patterns should not produce as a result. This is what allows investors to cut their losses short and let their profits run. Very simple rules can be applied to the high probability signal in pattern situations. How a price opens following a candlestick signal is a strong determining factor as to whether a trade is entered or not entered. The probabilities become greatly in your favor when you know what the price should be doing. This is not rocket science. This is merely taking advantage of the information that is built into candlestick analysis.

Chat session tonight at 8 PM ET. Everybody is welcome.

Good Investing,

The Candlestick Forum Team


Current Website Special

Fast Track to Trading

E-Learning Online Training Schedule

Options Training Course  

Commodity Training

Boot Camp

Website special reflects current newsletter. If you are reading an archived newsletter you will be directed to Current Website Special.

Stock Market Made Easy Using Candlestick Signals

Stock Market Made Easy with Candlestick Signals

The stock market can be made easy to learn when utilizing candlestick signals. The signals are merely investor sentiment put into a graphic depiction. The stock market can be made easy to learn when incorporating the information produced by candlestick signals. Not only can the stock market be made easy to evaluate, but also the candlestick signals can be utilized in all trading areas, commodities, currencies, bond prices. Applying the information conveyed in candlestick signals to other simple technical indicators creates a trading environment that puts the probabilities highly in the investors favor.

Profiting in the stock market is made easy when an investor realizes that prices move in patterns. Prices are influenced mostly by investor sentiment. Investor sentiment can always be graphically analyzed. The candlestick signals reveal changes of investor sentiment. Additionally, using candlestick signals helps identify where the extraordinary strength is coming into a trend or out of a trend. Being able to recognize a pattern set up allows the candlestick investor to participate in the high probability/high profit trades.

Witnessing a candlestick signal in an oversold condition followed by a gap up is a very reliable profit situation. Simply analyzed, the candlestick signal usually represents a change of investor sentiment. When this occurs in the oversold conditions, the probabilities are extremely high that a profitable trade will occur. A candlestick reversal signal in those conditions, followed by a gap up in price, clearly demonstrates that after the indecision the buyers started coming back into the price with enthusiasm. This is exactly the price trend that an investor wants to be in. A price coming out of the oversold condition with investors very enthusiastic about getting into that stock.

This can be clearly illustrated in the Longs Drug Stores Inc. chart, recommended by the candlestick forum the day after the gap up. Utilizing candlestick charts dramatically improves the ability to anticipate a potentially strong move. The gap up bullish candle occurred after a hammer/Harami. The stochastics revealed the price coming out of an oversold condition. The gap up through the 50 day moving average indicated that the 50 day moving average was not going to act as resistance. Being able to witness the series of doji’s that occurred during the prior two weeks before the gap up becomes significant information. There was a lot of indecision occurring. The gap up from that level immediately revealed that the decision of the new direction had been made. Also, a gap up illustrated that the decision was being made with considerable force. This type of analysis allows stock market analysis to be made easy.

Stock Market Made Easy, LDG

LDG

These patterns occur constantly. A recent recommendation was ELOS. The same scenario. A flat trading area show an indecisive trading with a doji followed by a gap up in price. The stochastics started to curl up out of the oversold condition. Where will he go from here? That now leads to what everybody else may be watching. Once it breached the 50 day moving average, the next target could become the 200 day moving average . Moving to that level would also fill the gap formed in late December.

Stock Market Made Easy, ELOS

ELOS

Using candlestick signals makes profiting in the stock market made easy. Investor sentiment will stay the same throughout history. The panic and enthusiasm of investors will constantly create recognizable trading patterns. These patterns have produced a high statistical probability results for centuries. And they will do so for many centuries to come. The advantage investors have today is having computer software programs that make identifying these patterns very easy. When applying candlestick signals to those patterns, the analysis becomes much easier yet.

The Candlestick Forum is making available a package of investor patterns training CDs. This eight CD package clearly demonstrates patterns that occur regularly in the markets. When candlestick signals are added to the analysis of these patterns, it creates a very profitable investment format. What should these patterns produce? Expected results! What becomes a primary factor for illustrating whether the expected results are occurring? The candlestick signals! When prices get to certain point of a pattern, the expectations of whether that pattern is working properly will be demonstrated by the candlestick formations.

High Profits with Candlestick Signals

The stock market becomes an easy medium for making money when using Candlestick signals properly. The stock market is the cumulative knowledge of all investors buying and selling during any particular time. Just like an individual stock, the stock market itself incorporates waves of human emotion. Whenever human emotion is involved with an investment entity, the Candlestick signals can visually clarify what those emotions are doing. The stock market can easily be analyzed when applying Candlestick analysis.

Being able to analyze the direction of the stock market greatly enhances the ability to extract profits. The fact that the stock market moves up and down without major changes in fundamental economic conditions from week to week is a clear illustration that fundamentals do not move markets, the perception of fundamentals is what moves markets. Candlestick signals identify what is going on in investor sentiment whether you are studying one-minute, five-minute, or fifteen-minute charts, or whether you are studying the daily, the weekly, or the monthly charts.

Candlestick signals visually depict the cumulative knowledge of everybody that was buying and selling during that specific time. Learning and understanding the 12 major signals found in Candlestick analysis not only allows an investor to identify reversals in a trend but, more importantly, allows an understanding of what investor sentiment created those signals. This produces a tremendous insight into understanding why the stock market moves the way it does.

Why go against the flow? If you can easily analyze, with the probabilities in your favor, whether the stock market is in an uptrend, a downtrend, or is trading flat, the Candlestick investor can greatly enhance their investing returns by positioning the portfolio in the direction of the stock market. Does this eliminate the possibility of a stock going up in a down market or vice versa? Definitely not! However, when trying to put all the probabilities in one’s favor, it is much easier to find individual stocks that have bullish signals when the market is heading up or bearish signals when the market is heading down.

Use Candlestick signals to your advantage. Learning the 12 major signals will dramatically improve your analysis of the stock market direction. Being able to analyze the times when the market is demonstrating Candlesticks buy signals after an extended downtrend eliminates the “grabbing the falling knife” concept. Candlestick buy signals in an oversold condition illustrate that the buyers are finally stepping in. Does that represent the absolute bottom? No, but it does indicate that the probabilities are now in your favor to be adding long positions and closing short positions. This is not rocket science. This is using indicators that have worked successfully for centuries.

As illustrated in the Dow Jones chart, when stochastics are in an oversold condition and Candlestick buy signals start forming and, seeing the Spinning Top followed so far by the Bullish Engulfing signal, it becomes a high probability situation to start buying. Stop loss procedures become very simple when seeing where the buying becomes negated.

High Profits with Candlestick Signals, Dow Example

DOW

Online stock trading can utilize the instant analysis that is produced by simple charts. The visual interpretation of Candlestick signals is very easy. Being able to apply other important technical indicators to the Candlestick signals immediately produces a huge profit potential. Gone are the days of having to calculate each indicator. The charts of today expedite online stock trading analysis tremendously. Learn how to use the Candlestick signals with these confirming indicators and the probabilities of being in a correct trade expands dramatically. This is not rocket science. The 12 major signals in Candlestick analysis will provide more trade opportunities than most investors will ever require.

Basics of Stock Investing

Whether you are beginning investing in the stock market or an old hand, knowing and sticking to the basics of stock investing is always a good idea. So, what are the basics of stock investing? The basics of stock investing are that you are buying shares in the ownership of a company. You do not have the right to run the company but you can vote your shares on major company issues and help elect a board of directors once a year. You are not personally liable for company debt or actions and if the company goes bankrupt your claim on the assets of the company is less than that of creditors.

Companies sell stock and give away partial ownership in order to avoid debt repayment and interest payments. The benefits of stock ownership are the receipt of dividends and the appreciation of the value of your shares of stock. Over years and decades stocks in American stock markets have substantially outperformed bank interest as well as government and corporate bonds.

One of the basics of stock investing is the decision to “buy and hold” stock or to trade stock. The buy and hold strategy says that it is really not possible to outguess the market and all you end up doing when you repeatedly buy and sell is make the stock broker rich and repeatedly pay taxes on capital gains. The stock trading strategy relies on individual stocks having their cycles, their ups and downs. Thus, the stock trading strategy says that you can make even more money by market timing than by using the buy and hold strategy. Another of the basics of stock investing is that, even as a small investor, you have a right to have your voice heard at the annual meeting. You can attend and you can speak your mind. However, the number of votes you can cast on any issue is the number of shares that you hold.

Receiving a stock certificate is one of the basics of stock investing. You are entitled to hold this certificate personally. However, you need to keep it in a safe place like a safety deposit box and you need to present it if you selling shares of your stock. Thus a stock investor will usually leave his or her stock certificates with the brokerage through which they buy or trade stock. This is known as holding your shares in “street name.”

How you are paid and how much your stock is worth is usually the most important of the basics of stock investment. Many companies take part of their profit after taxes and send quarterly dividend checks to their shareholders. This is a nice benefit of stock investing, especially for retirees. However, the dividends are taxable and the profit of a US company is taxed at 50 before the dividend is paid. Thus many companies reinvest nearly all earnings in order to grow the company.

Stock appreciation is important. If you invest in a stock that appreciates in value at 10 to 12 percent a year, which is not uncommon, the value of your shares will double every 6 to 7 years. In fact, the company will often “split” the stock and issue two or three shares for one when the stock price goes up substantially. This is another reason to leave your stock in street name. Unlike when you trade stock you need not pay taxes on the long term appreciation of your stock shares until you sell stock. This untaxed appreciation of stock value can substantially improve the exponential growth of stock value.


Market Direction

Candlestick analysis allows an investor to analyze which price movements work most effectively under specific market conditions. The past few weeks have demonstrated a Dumpling Top formation in the Dow. At the same time, the NASDAQ has been trading relatively flat. Most investors acquiesce to the fact that they cannot make a lot of money during a sideways market condition. However, the candlestick investor has the advantage for being able to analyze which price movements/patterns will work effectively during a lethargic market conditions.

Basics of Stock Trading, DOW

DOW

A major facet of investing is putting high profit/high probability situations to your advantage. Many investors do not consider the probabilities when they are entering trades. Candlestick signals/patterns allows an investor to apply the appropriate positions to the appropriate market conditions. As experienced, the past few weeks have provided evidence of a Dumpling Top. As described in last weeks newsletter, the Dumpling Top is formed by indecisive trading that has a rounding top trajectory. The quick oscillating price movements in a Dumpling Top formation make it very difficult to find and establish profitable trades. Fortunately, there are patterns that work extremely well in these market conditions.

The Fry Pan Bottom pattern works very effectively when the market is not showing decisive direction. Although the Dumpling Top eventually produces a very definite result, it’s formation is the result of indecisive trading. Until the decisive result occurs, a strong downward move, the Fry pan bottom pattern does not experience any change of investor sentiment that would result in the termination of a pattern. The longer there is not a strong reversal of a bullish trend, the operative word being ‘strong’, a Fry pan bottom pattern will continue to work effectively.

MNKD was a recommendation of quite of few weeks ago. It demonstrates the inherent strength of the pattern as long as there is no dramatic change in the overall market sentiment. The pattern itself has developed by the gradual buildup of investor sentiment. It feeds upon itself, provided there is no dramatic outside influence that would change that sentiment. Although relatively unexciting, the profits produced by a Fry pan bottom pattern could be significant when the rest of the market does not providing any opportunities.

Basics of Stock Trading, MNKD

MNKD

GMXR also illustrates the results of a Fry pan bottom when the market is sluggish. The results of candlestick analysis are not created from highly sophisticated investment formulas.

Basics of Stock Trading, GMXR

GMXR

Basics of Stock Trading, FOE

FOE

They are the results of centuries of observations by the Japanese Rice traders. Learning how to use candlestick signals correctly is merely taking advantage of the information Rice traders gleaned from reoccurring price patterns. Understanding the information built into candlestick signals takes the subjectivity out of trend analysis.

Chat Session tonight at 8 pm ET – Discussing the best patterns for these market conditions. Click here for instructions.

Good investing,

The Candlestick Forum Team


Website Specials

Click here for details

Website special reflects current newsletter. If you are reading an archived newsletter you will be directed to Current Website Special.

Stock Trading Strategy

Stock Trading Strategy for Day Traders

There are two types of trading strategies that are relevant to day trading that we will discuss today. Leverage and short selling are very common among day traders due to their potential for high returns, however of course with high return comes high risk. It is very important that stock traders have the knowledge, financial means, and discipline required to practice day trading for a living. In fact, it takes some time before many investors are able to day trade successfully, however those that are willing to take the time necessary can be very successful.

One important stock trading strategy that we will discuss is leveraging. Leveraging occurs when an investor borrows money to make more money on his or her trades. When you place a trade with you own, money and then add borrowed money, you have the potential to double your return. Of course the investment risk comes in the event you lose out on a particular trade. Then your losses can double as well. It is a very risky way to trade stock but again, if done carefully can bring great returns.

This stock trading strategy requires the use of a margin account. Buying stocks on margin, also known as margin trading, is how traders actually borrow the money in order to practice leveraging or short selling stocks. A margin account is different from a regular trading account and it requires at initial investment of at least $2,000. Once a trader has a margin account, he or she can borrow up to 50% of the purchase price of a stock. There are requirements of course when buying on margin. For instance the trader must maintain a certain balance in his or her margin account in order to qualify to borrow money.

Another trading strategy that also involves the borrowing of funds is shorting stocks. Shorting is the opposite of investing in stock with the goal that the stock’s value will increase. When selling short, you actually want the value of the stock to decrease! How it works is that the trader first borrows money from a broker for a set number of shares. Then the trader sells the shares, and once the security goes down in price, he buys the shares back. He then returns the set number of shares to the broker at the current (and hopefully cheaper) market price allowing the trader to keep the difference. This is a stock trading strategy that many investors have a hard time understanding however it really is no harder than your typical stock trading.

Continue to explore other trading strategies such as leveraging and short selling and find one that works for you!


Stock Trading Strategy, NASDAQ

NASDAQ

The same analytical tools can be applied to individual stock prices. The more indicators that can be analyzed as acting as support for a candlestick signal, the higher the probability of being in a correct trade at the correct time. Add the factor of a candlestick pattern also forming, that makes the probabilities of the trade being highly profitable all that much greater. The ATLS chart becomes a strong buy when you apply the candlestick signal information on top of the other indicators. After a pullback down through the T. line, a spinning top signal used the 20 day moving average as support. A quick visual analysis confirms the 20 day moving average acting as an influence on the stock price. It can be assumed the 20 day moving average is continuing to act as support and a Jayhook pattern is trying to form. This makes for a very easy entry strategy. A positive open tomorrow would induce entering this trade, using a close below the T. line as a stop.

Stock Trading Strategy, ATLS

ATLS
The entry-strategy decision was based upon the confirming indicators making this a strong trade possibility. Investing should not be a difficult process. The more simple the analytical tools, the greater the probability of being in a correct trade. Once a trade direction can be established, the candlestick investor now has a greater array of investment tools to apply to the trade. It can be leveraging the trade on margin or establishing an option trade. Most investors do not have an investment plan. They buy stocks based upon an array of sources. These sources usually are different for each established position. One could be a Jim Cramer recommendation. The next one might be a brother-in-law hot tip. Most established positions have no game plan for exiting the trade. That is what makes candlestick analysis very mechanical. You can buy based upon a candlestick buy signal and sell based upon the appearance of a candlestick sell signal.


Option Traders

The Candlestick Forum option trading training session will be scheduled in the next few weeks. Please keep your calendars open for a weekend boot camp on Option Trading with Candlestick Signals. Whether a beginning option trader or seasoned investor, you will gain valuable insights in how to establish option trades with a dramatically improved entry strategy. The common sense aspects applied to option trading will be the same common sense insights that are found in candlestick analysis. Details of the option trading weekend boot camp will be available on the homepage over the next few days.

Good investing,

The Candlestick Forum Team


This Week’s Special

Eliminating Emotions

Stephen Bigalow’s latest E-Book

Click here for details

Website special reflects current newsletter. If you are reading an archived newsletter you will be directed to Current Website Special

An Overview of Options Orders

Options orders are defined simply as an agreement between two investors where one party agrees to deliver something in the stock market to another party within a specific time period and for a specific price. The standard concept of ownership does not exist because you don’t need to own a particular stock in order to implement a position. Have you purchased a position and now you are interested in short selling that option? In the stock market you would have to borrow the stock to do it; in options trading only need to understand that there is no ownership and no problem making the transaction.

An options order or stock order, whether it is a “call” (an agreement to purchase) or a “put” (an agreement to sell), gives the holder the right to trade options; in addition, the holder is entitled to simply let the options order expire without investing further. Options orders can be low-risk ways to make money in the stock market because many times you can exit an option order that is unfavorable for only the price of the premium.

Types of Options Orders

Options orders cover in a number of different scenarios, offering the investor the ability to buy or sell and setting conditions for the transactions. The following are some of the options orders that are available:

  • Buying Calls – Buying a Call is a bullish options order on an underlying stock value. The investor has the opportunity to speculate on the rise of the stock’s value for the term of the contract with a predetermined risk. Most investors will look to sell their contract at a profit, while others may intend to exercise their right and purchase the underlying shares.
  • Buying Puts – Buying Puts is a bearish, somewhat speculative options order in which the investor anticipates that a stock will decrease in price during a set period of time. The trader realizes a profit when the stock and its underlying put option decrease in price during a set amount of time.
  • Selling Puts – When you sell puts, you are selling someone the right to sell you the underlying asset at a fixed price, on or before the expiration date of the option order. You can use this options order when you are bullish on the market and feel that it isn’t likely to go down in the short term, you can sell puts on a quality asset that you would like to own at a discount.
  • Selling Covered Calls – Selling a covered call is an options order where investors are willing to pay for the right to take a stock if it reaches a much higher price. It is an excellent strategy to implement while waiting for a stock to reach your identified sell point.
  • Put Hedge – A Put Hedge is an options order comprised of buying puts during a bearish market to protect stock shares that, while the trader is reluctant to sell, are vulnerable to a decline in the market. Successful traders utilize strategies such as Put Hedges to insulate their portfolios from loss in a bearish market. This method also has the potential of unlimited profits, while at the same time limiting the potential loss by the investor.
  • Calendar Spread – A Calendar Spread is an options order that involves selling an option with a date that is close to expiring against the purchase of another option, of the same strike price, that has a later expiration date.
  • Selling Bear Calls – Basically, this options order strategy is to buy out-of-the-money call options and sell in-the-money call options on the same stock with the same expiration date. The plan is that the in-the-money stock closes lower than its strike price at its expiration date, and then the trader realizes maximum profits from Selling Bear Calls.
  • Selling Strangle – This options order involves selling an out-of-the-money call option and an out-of-the-money put option with different strike prices on the same asset with the same expiration date.
  • Selling Straddle – Similar to Selling Strangle, this options order is a technique that involves selling a call option and a put option on the same asset with the same strike price and expiration date.
  • Selling Covered Calls – Selling a covered call means that there are investors willing to pay for the right to take a stock if it reaches a much higher price. By selling covered calls, you are able to accumulate income passively over time by collecting the premiums on your options.
  • Buying Strangle – A strangle buy is implemented by purchasing a call option and a put option on the same asset with the same strike price and expiration date.
  • Buying Straddle – A buy straddle is implemented by purchasing a call option and a put option on the same asset with the same strike price and expiration date. This is a desirable move because the risk is limited to losing the premium paid but its reward is unlimited.
  • Buying Calls – Buying a Call is a decidedly Bullish position on an underlying stock value. The investor has the opportunity to participate in the rise of the stock’s value for the term of the contract with a predetermined risk. Most investors will look to sell their contract at a profit, while others may intend to exercise their right and purchase the underlying shares.

Conclusion

There are quite a few more options orders available for your use; discussing your options orders with your broker can help to identify those that are available to you. Whether you are looking to capitalize on an upward movement of a stock or make defensive profits in a bear market, options are an excellent way to make money investing in the stock market.