Stock Trading Programs

Telechart Trading Program
Hello Investors,

Are you the type of person that wants to have all your questions answered immediately when trying to learn a new investment program? Wouldn’t you like to get instant explanations and recommendations when viewing a Candlestick chart or pattern, directly from Candlestick experts? Join TeleChart 2005 Platinum through the Candlestick Forum and chat with Steve Bigalow LIVE!  Join Steve and fellow candlestick traders in the “Candlestick Forum” club on TeleChart 2005 Platinum. The Candlestick Forum, in association with TeleChart 2005, now provides the most direct, fast path method for becoming an expert in Candlestick investing.

Purchase of TeleChart 2005 is separate from the Candlestick Forum paid membership service. You will find Stephen Bigalow in the Candlestick Forum  club  hosted through TeleChart 2005 and listed in their Club Directory. This club is open to all TeleChart2005 users.

TeleChart 2005 Platinum users look for the Candlestick Forum in the Club Directory.  Join Steve and other members in the “Candlestick Forum” club on TeleChart 2005 Platinum.

Club Name:        Candlestick Forum

Every effective investor needs the right tools to make good market decisions. Cutting edge information, great price charts, sound investment advice…these are all critical components in developing a solid, money-making investment strategy. Now all these tools and much more have been brought together in one place!

The Candlestick Forum and TeleChart 2005 …The Ultimate Stock Market Information Network!

Combining cutting-edge information sharing and news with the quality charting and data service you’ve come to expect, TeleChart 2005 Platinum is really is your solution to market research. Plus—you can get my commentary and reports on key stocks without ever leaving the charting program!

Check out these amazing features in TeleChart 2005 Platinum:

· Streaming data

Ø TeleChart 2005 Platinum service automatically includes streaming, real-time data and intraday charts. Because of TeleChart 2005 Platinum’s unique replicated servers and exclusive new AccuTick™ technology, you enjoy some of the most reliable and accurate Real Time data available. Plus—you can choose from a developing list of Real Time sort criteria applicable to the streaming data on intraday charts updated every 60 seconds…and we even pay your exchange fees!

· Real time alerts

Ø TeleChart 2005 Platinum also allows you to send real time alerts to your e-mail or pager. You can be alerted of price changes or important developments for any number of stocks in the system.

Ø In TeleChart 2005 Platinum, you are automatically part of an investor group keenly interested in learning more about the Stock Market and in benefiting from the commentary from top analysts in today’s market. And, you will now have access to my notes and reports on stocks, broader market issues and trends and Japanese Candlestick chart interpretation.

Ø Plus: You can now chat live with the entire TeleChart 2005 Platinum customer base about any ticker symbol in the system! I’ll be leading guided chat events where we can discuss individual stocks or industries…and remember, it’s all without ever leaving your charts! Learning about Candlesticks is now even easier by having this direct access to the experts. Just imagine… having one of the world’s leading experts looking over your shoulder and acting as your mentor!

· Shared Notes

Ø You can also publish your own notes to the TeleChart 2005 Platinum community. And, since your charts automatically attach to notes you get quick access and easy organization for this wealth of information.

· Live, continuous news feeds

Ø You have immediate access to TeleChart 2005 Platinum’s high quality news and information service built right into the program! You can read the hottest news stories about any stock continuously throughout the day and in real time! Plus—you get the latest earnings reports and announcements every day.

These great informational tools are built into the #1 charting service available. And all of this is automatically yours in your Candlestick Forum / TeleChart 2005 Platinum service. The most exciting thing for me—I can provide TeleChart 2005 Platinum for you at only $99.99 per month!

To sign up, simply click  to go to the Worden Brothers Website to review enrollment options. TeleChart 2005 Platinum will get you signed up to the system and get you started. You’ll soon be finding out why I know The Candlestick Forum and TeleChart 2005 Platinum will soon become your definitive market research solution!
How I Discovered Japanese Candlesticks

Have you ever wondered why you hear stories of other people making fortunes in the stock market or trading in the Japanese Yen or whatever, and you never seem to make more than a moderate return each year at the very best? I wondered that for many years myself. So what is the best stock market investing advice?

I always asked myself the question, “What are these people doing that they can make fortunes in the market and I can’t even hit my butt with either hand? I always heard that you can’t time the markets. And the most common investment advice was to find a well-managed company and hold it for long term growth. But if that was the case, then how do some people make fortunes in the markets while the vast majority of investors make moderate to poor returns? Why do Warren Buffet and George Soros have fantastic reputations for producing extraordinary returns? If the markets can’t be timed, why do they always seem to be able to pick the tops and bottoms better than the average money manager?

Twenty-five years ago I started searching for methods that would not only outperform the markets but also pull out huge profits. If one learns from their mistakes, I was becoming one of the smartest investors ever, at the cost of not making any money! I learned every technical investment method that I could get my hands on. Elliot Wave theory, moving averages, pattern recognition, momentum, stochastics, Bollinger Bands, timing oscillators, Fibonacci retracements, divergences. You name it, I learned it, trying to find a consistent method to produce profits.

Buy low and sell high! Can’t get any simpler than that, yet I would hear great things about a company, invest in it and watch it go straight down. When I couldn’t stand the pain any more, I would sell and take my losses. Inevitably, I would be selling out at the bottom. Of course that would mean I had usually bought at the top.
So what was my problem? I thought I was reasonably intelligent, as we all think we are, and I loved to invest. However, I was a constant contributor to somebody else’s stock market profits. This went on for years. I kept hunting for that proven, tested trading system that would make me rich. I looked at every new “wonderful” investment program that was being touted, that promised “amazing results” with the divulgence of “never before exposed market secrets” and if you were lucky, these secrets were not even known by the Wall Street experts. Boy oh boy.
Being the wizard that I thought I was, the first thought that would come into my mind would be, “If this amazing secret was so spectacular, then why are you letting me buy it from you for a mere pittance of the profits that you could make for yourself by using it?” Clever reasoning I thought, but then I’d pay the money anyway.

Then My Investment Career Made A Complete Turnaround!

I discovered the Japanese Candlestick method. It was being hyped by an Investment Hyping firm. So I looked at it with the same skepticism that I did with all “wonderful” new investment programs. Except through all the hype, two unique aspects could be observed. With very little investigation, it was obvious that this trading methodology was not “new secrets” from Japan being suddenly exposed to the world. The signals had always been around. Nobody from the Western hemisphere ever took the time to investigate them, to see what made them so successful.

Also, the signals did not involve difficult formulas or extensive calculating processes to master the system. All that was required was to observe predetermined signals coordinated with some simple confirming indicators. Simple enough. IF the signals worked like they proclaimed they did, then past charts would have an inordinate amount of patterns that confirmed a change of direction when all the stars aligned.

As I did my normal research, it started to become evident that the signals could be seen an inordinately high percentage of the time at the turns in a price trend. I began to pay more attention to current signals.

I noticed that companies could be getting negative comments from analysts or the talking heads on the financial news stations commenting on how bad things were in that particular industry. Yet a bullish signal forming in those stocks would be followed by a continuing upward price movement after the buy signal appeared, no matter how many negative opinions were aired on the financial stations. This was not an unusual occurrence. It happened time after time.

After years of chasing the hot stories or the great recommendations from brokerage firms and not make any profits, the candlestick signals actually had me looking for stocks that were appearing to bottom out. What a unique concept! Buying at the bottom. Conversely, when a stock or an industry was being given great accolades in the media and a Candlestick sell signal appeared, it became very obvious that the sell signal was the correct indicator versus all the euphoric speculations on where the stock or the industry might be heading.

I was now looking for “buy” signals at the bottom and “sell” signals at the top. A complete turnaround from my early years of investing. But the profits were now consistently flowing into, not out of my trading accounts.
The signals demonstrated extremely high profit results year after year. Whether in stocks or commodities or any other investment vehicle, the results were inordinately impressive. Witnessing the different positions of the confirming indicators produced more refinement for eliminating the less productive signal formations. My “correct” trade ratio kept expanding. Profits kept compounding dramatically.

Learning the psychology behind accurate stock enter signals will truly alter your investment aptitude. You will start looking for “buy” signals in oversold stocks. You will start anticipating when to take profits in overbought stock positions. Remember, you are not being shown “secrets” of the investment world. You will be learning a trading program concept that will educate you on how the common investor thinks, then turn that thinking into huge profits. And you will learn how to do it without having to experience all the learning bumps that I did.

Coming around full circle, thinking what I would be thinking if I was reading all of this, is the same question that I would pose to all the other magnificently sounding investment programs that are on the market, “If this trading program is so great, why are you exposing it to everybody else?”

The One Major Drawback to Japanese Candlesticks

Through the years it became apparent to me that the Candlestick trading signals were truly profitable trading indicators. So accurate that this system should be catching on like wildfire. However, the more I became convinced that the Candlestick methodology outperformed all other technical methods, the more I was surprised that very few people knew about its benefits. Very few. It was hard to find anybody who could intelligently converse about the signals. I can count on one hand the number of people that I could talk Candlestick trading with over the past ten years. And most of them had published books on the subject. The problem was that there was nobody to analyze my analysis, to confirm or reject what I saw in a signal formation. Essentially nobody knew how the Candlesticks worked and how positively effective they were.

It became apparent that this lack of knowledge would be detrimental in trying to establish a hedge fund using the Japanese Candlestick trading method. Convincing investors to invest in a fund that produces extraordinary returns, using Japanese Candlesticks, not a sophisticated sounding trading method, would be an uphill battle if trying to market to an uninformed public.

The truth of the matter is that teaching thousands of investors to utilize Candlestick investing will never affect any investments that the Candlestick Forum would be participating in. Each investor has their own specific areas of investment interest. Large cap stocks, bonds, grains, currencies, meats, options, and dozens of other investment vehicles will be the object of their investments. Even thousands of new Candlestick investors out in the investment arena would be a drop in the bucket compared to the many millions of investors in the world.

Take advantage of this candlestick investing knowledge. It will not take weeks or months to verify whether the signals work. They will prove themselves instantly. If you always keep in mind that the signals are the result of a change in investor sentiment, your road to extracting great amounts of profits from the markets will occur very quickly.

Good investing,

Stephen W. Bigalow

Profitable Day Trading Using Candlestick Charts

Day trading, a trading technique popularized to the general investing public in just the past 5 to 7 years. This phenomenon resulted from the severe market daily declines in 1987 and a few in the early 1990’s. The huge down days made it impossible for investors to get in communique with their brokers. So, it was legislated that access to the markets had to be available to everybody, thus the electronic trading systems. Day trading blossomed in the early to mid 90’s.

However, the original day trading techniques, having electronic signals showing quick arbitrage situations, producing huge profits, has disappeared over the past two years. But day trading is still very profitable when used with candlestick signals. The old methods disappeared, but new products were developed that made day trading still viable. The exchanges set up market index trading entities. The Spiders for the S&P index, the Diamonds for the Dow and the QQQ’s for the Nasdaq. These highly liquid trading entities make for excellent trading vehicles for day trading.

Fortunately, candlestick signals clearly illustrate the change in investor sentiment for any time period; monthly, weekly, daily, hourly or by the minutes. A minute chart is valuable for the day trading technique. Combining stochastics with candlestick signals, even on a minute to minute basis, produces highly accurate results. Day trading has a very viable platform to work from when the signals and stochastics coordinate.

Producing the right combination of time segments can formulate low-risk, high potential day trading setups. For example, the active day trader may use the 1 minute, 3 minute and 10 minute charts to establish their trades. The 1 minute, 5 minute and 15 minute chart combination works extremely well. Other day trading programs, set for two or three trades per day, may use the 5 minute, 15 minute, one-hour combination.

Combining multiple charts creates a basis for catching the intraday trends. Day trading in this manner requires getting in and getting out of trades right at the reversal points. The candlestick signals provide this information. Day trading without a method to take advantage of accurate reversal signals produces much reduced profits. Day traders should utilize candlestick stock analysis for clear entry and exit strategies.

Note in the following example that observing all three charts may produce validity to a day trade. Day trading becomes easier when the visual road map can easily be determined.

Candlestick Day Trading

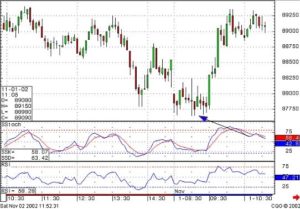
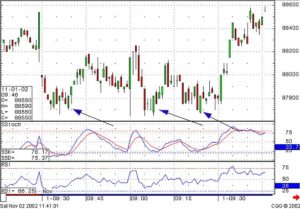
Note how the one minute chart of the S&P, a favorite of the day traders, keeps revealing candlestick “buy” signals at the same support area. Those signals would alert the candlestick investor to the fact that buying was clearly obvious every time the sellers brought the S&P down to this level. Day trading these “buy” signals would require some visual backup.

Day Trading Chart 5 min

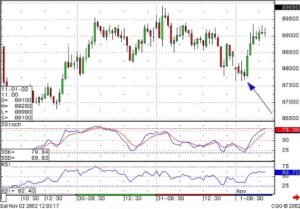
The five minute chart reveals the same factors. Oversold stochastics. The shadows are all showing support at that one level. The Spinning Tops are demonstrating indecision. Now the 15 minute chart should be perused.

Candlestick Day Trading Chart, 5 min

This day trading technique can be applied to any trading entity that has sufficient volume. Using the signals at the proper stochastic period can produce consistent day to day profits. Mr. Bigalow has traded the S&P E-Mini’s for years. Use the forum, chat room or e-mail the site to learn more about how to use candlesticks with your own day trading program.

Other Day-trading articles of interest

The Dynamic Doji
One of the most revealing signals in Candlestick Trading

Effective Stock Market Trading Systems
Why try to swim against the current – Trade with the market trend

Candlestick Forum Services

The Candlestick Forum provides the ultimate trading environment. Giving the individual investor essential tools to profit in any market! Trade with Stephen Bigalow and our active member community.

FREE PUBLIC SERVICES

Stock Chat
Stock Chat is a weekly live internet presentation provided by Stephen Bigalow. These interactive sessions begin with reviewing current market conditions, and charts of interest. Mr. Bigalow illustrates ‘charts of interest’ poised to make profitable trading candidates. A Question and Answer period at the end of each session where YOU may ask for review of specific trades and answers to questions on technical analysis. Click HERE for more details.

Free Newsletters
Timely market advice provided completely free of charge or obligation! Twice weekly publications for evaluations of the DOW, NASDAQ, S&P, Bonds, and other market entities. Each newsletter includes interesting and profitable elements of candlestick signal formations with insights into why a price move occurred. Plus, alerts for upcoming free webinars and website specials. Who knows, perhaps one of these articles will change your financial future! Your email address is kept strictly confidential and will never be sold, traded, or shared with any third party. To signup, scroll up to the top of your screen and enter your email address in the ‘Free Newsletter” field – PLUS, Receive free download.

Free Resources
Your One-Stop Shop for Japanese Candlesticks! This area is packed with all the ‘How To Trade’ details for each candlestick signal. The basics of Japanese Candlesticks, the Twelve Major Candlestick Patterns, Secondary Signals, and Continuation Patterns. All the signals include illustrations, pattern recognition, psychology behind the pattern and related articles. Each Signal ready to Print and save for Quick Reference! Click HERE to go to Free Resources.

Daily Stock Market Reports
Start your trading day with Stephen Bigalow’s market comments to know where the stock market is heading. Plus, Monthly Archives of Steve’s Personal Trading Diary. See what goes into his analysis in search of profitable trades. Click HERE to go to Daily Stock Market Reports.

Events and Training
Mr. Bigalow gladly supports trading clubs and frequently accepts invitations to speak. Keep track of upcoming locations in your area. Look for announcements for Where in the Heck is Stephen Bigalow, he may be attending an event in your area. Click HERE to go to Events & Training.

Discussion Forum
Enter the Discussion Forum and enjoy a community of traders, helping each other! This is open to the public and one of our most popular free formats where fellow traders share hot tips and trading techniques. Always open!


PAID MEMBERSHIP SERVICES


Live Trading Room
This active Trading Room is reserved for Members’ Only. Our Moderated Internet Stock Chat provides the perfect format for success. Stephen Bigalow begins just before the Opening Bell with a brief pre-market review, open positions review, and is available for specific questions during the first and last hours of the trading day. Our Moderator shares charts of interest as new trading opportunities developed during the day. This Live audio/video chat room is active with serious traders sharing their techniques and is included in all membership subscriptions. There are NO additional license fees or charges for accessing the HotComm Platform. (If you have already joined us for our FREE open Stock Chat on Thursday evenings, the Members’ Trading Room is the same HotComm Platform.)


Daily Market Comments
Not everyone can be online live during the market hours. (Darn those pesky Day Jobs!) Access the morning and afternoon member market Comments for a brief summary of market conditions and important updates on open stock positions.


Daily Stock Picks
Chosen by Stephen Bigalow as the best trade potentials for the day. These are more than simple  ‘buy and sell’ XYZ – Every market day Steve selects 2 -3 of his favorite stocks. Presented in a ‘Flash’ video to illustrate the setup with instructions for entry points and stop loss settings.


Long Term Stock Picks
One Long-Term Stock Pick is selected each month for consideration to add to your portfolio. The same format as our Daily Picks but geared for a longer holding period. And, like our our Stock Picks, Steve reviews these during the weekly Member Only Stock Chat.


Stock Chat
Members receive a private – Members’ Only Stock Chat each week. These sessions run approximately one hour and typically held on Monday evenings at 7PM ET. An invaluable hour to ask Steve to review any stock chart and answer specific trading questions. The first 30-minutes Steve provides a market overview and updates on open Stock Picks. There are ‘Bonus’ Stock Chats from time-to-time with Guest Speakers to introduce new trading techniques. Plus, our Moderator frequently adds a special Sunday night session for planning for the week ahead. All Stock Chat sessions are recorded and available for playback within 24 hours.


Commodity Picks
One Commodity Pick each month with ‘Flash’ video review provided by Stephen Bigalow. If you are new to commodities this will give you a great training ground. Commodities do not move the same as the stock market and on occassion when the previous Commodity Pick is still going strong, we continue before selecting a new one.


Open Position Followup
There are two formats available to review open Stock Picks – A ‘Flash’ video is available for an audio/video review of all open positions – OR – You may choose to select a ‘Text Only’ format for print-out.


Position Summary Table
All open Stock Picks are formatted into a spreadsheet and can be sorted by all column headings that allow you to review new, open, or closed Stock Picks. This provides for quick sorting by Symbol, Date, Long or Short Positions, Entry Range, Stop Loss, Position Status (new – hold – closed – not executed), and Action Alerts. As an added feature, click on each stock symbol for quick direct to the ‘text’ followup.


Free Video of the Month
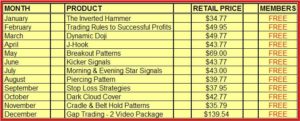
Each Month Members receive a new Product for Quick-Download – FREE as part of membership subscription. The schedule below lists the FREE Member Downloads for 2007

Member Video Schedule 2007
 
Member Discounts
Members receive a 10% discount on all Products and Services – Always!
Plus, new members receive an immediate coupon for 20% off  first purchase!


We believe you will agree the benefits of Membership are a wise investment at a great value!
Need  a little  incentive?….
Look below for the FREE Products you receive for Quick-Download immediately after you join!

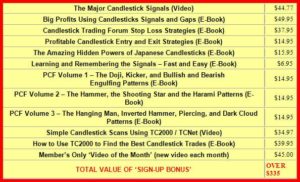
New Sign Up Bonus
 

All membership periods renew automatically until cancelled. Should you decide the Candlestick Trading Forum is not for you, simply cancel the automatic renewal from your member profile or contact us to discontinue automatic renewal. You keep $335 worth of new membership products just for trying The Candlestick Trading Forum.

Participate with other serious investors and become part of  the Candlestick Trading Community

JOIN NOW!

Understanding Candlestick Patterns

The Major Japanese Candlestick Patterns

There are really only 12 major Candlestick patterns that need to be committed to memory. The Japanese Candlestick trading signals consist of approximately 40 reversal and continuation patterns. All have credible probabilities of indicating correct future direction of a price move. The following dozen signals illustrate the major signals. The definition of “major” has two functions. Major in the sense that they occur in price movements often enough to be beneficial in producing a ready supply of profitable trades as well as clearly indicating price reversals with strength enough to warrant placing trades.

Utilizing just the major Japanese Candlesticks trading signals will provide more than enough trade situations for most investors. They are the signals that investors should contribute most of their time and effort. However, this does not mean that the remaining patterns should not be considered. Those signals are extremely effective for producing profits. Reality demonstrates that some of them occur very rarely. Other formations, although they reveal high potential reversals, may not be considered as strong a signal as the major signals. Learn these signals to find the best stock picks.

Stock Investing Basics of Japanese Candlesticks

Candlestick trading analysis does not require knowing intricate formulas or ratios. Candlestick stock analysis does not require massive amounts of education to effectively utilize the signals. The stock investing basics of Japanese Candlesticks result in clear and easy to identify patterns that demonstrate highly accurate turns in investor sentiment. The average investor does not have to be dependent on the investment professional, a professional whose recommendation does not always have your interest at the forefront. Whether totally unfamiliar with investment concepts or very sophisticated in investment experience, the Japanese Candlestick trading formations are easily utilized. The signals and patterns are easy to see.


Major Signals Educational Package

Act Today and receive Over 8 hours of video tutorials on The 12 Major Signals for only $12.00

(retails in our site for over $500)

Limited One Time Offer for a small $12 processing fee!

PLUS – 30-day Free Trial Membership if ordered today


Candlestick Chart Illustrations

Japanese Candlestick charting dramatically increases the information conveyed to the visual analysis. Each candlestick trading formation or series of formations can clearly illustrate the change of investor sentiment. This process is not apparent in standard bar chart interpretation. Each candle formation has a unique name. Some have Japanese names, others have English names. Where possible the English name and Japanese name will be given. The Japanese names will be done in Romanji writing so that English speaking people can say the names.

Single candles are often referred to as YIN and YANG lines. These terms are actually Chinese, but are used by Western analysts to account for opposites; in/out, up/down, and over/under. INN and YOH are the Japanese equivalents. YIN is bearish. YANG is bullish. There are nine basic YIN and YANG lines in Candlestick analysis. These are expanded to fifteen to cover all possibilities clearly. The combination of most patterns can be reduced to one of these patterns.

Candlestick Images and Explanations – Candlestick Signals with Illustrations, pattern psychology and recognition.

Profitable Commodity Trading Using Candlestick Charting

Commodities, feared by the majority of investors. Feared because commodities are highly leveraged and can wipe accounts out. At least, that is the general opinion of commodities. True commodity trading appreciates commodities more than stock trading. Commodity trading has much less outside influences for moving price than stocks. Commodities are not influenced by interest rates, accounting mistakes, poor management decisions, political rhetoric, etc. Commodities are mainly influenced by supply and demand, and maybe a few other outside influences such as weather conditions. This makes candlestick charting much more accurate when trading commodities.

Remember, Japanese Candlestick analysis was developed while trading a commodity, RICE. The Honshu family not only became wealthy from rice trading, they became legendary wealthy. Not with sophisticated computer programs, just basic eyewitness analysis and results. Results that were measured by actual profits. Money on the line profits.
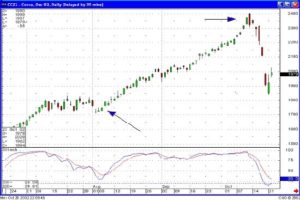
Commodity trading is too risky to attempt without some sort of trading program. Shooting from the hip will not make you money in the commodities market. That makes candlestick charting a gold mine when trading commodities. The same depiction of fear and greed seen in stock trading is easily seen in commodity charts. It becomes apparent when viewing commodity charts that commodities have much smoother trends. Note in the Cocoa chart, that once the trend started up, it did not waffle from its ascent.

Commodity Trading Candlestick Chart

Commodity Trading Chart

As seen in the December Cocoa chart, after it was recommended due to a gap up in price, the trend stayed very consistent over the next month and a half. No great swings caused by outside influences. This steady price move is much more evident in commodities versus stock prices. Also, when a clear sell signal appeared, the Bearish Engulfing pattern, the new trend produced a fast and consistent move.

Candlestick charting has become very valuable due to the consistency of the commodity price moves. What was once considered highly speculative investments has become credible income generators. When the trends can be clearly identified, the risk is dramatically reduced. The candlestick signals applied to commodities still illustrate the same investment psychology as seen in any other investment vehicle.

The adage in commodity trading is that if you can hit a 55% correct trade ratio, you will make a fortune. Commodities move with the same oscillations as witnessed in most trading entities. Moving from oversold to overbought ranges produces high probability trades. Trading commodities allows the investor to have a market to extract profits when other trading markets, such as the stock market, are not providing a good investing environment.

Commodities usually trade independently of other commodities. Unlike the stock market, this eliminates the prospect of a related company’s “bad news” affecting a position you own. This is not to say that some commodities don’t trade in tandem, such as soybeans and wheat or live cattle and feeder cattle. But this is not an extensive list to be concerned about.

The Candlestick Trading Forum utilizes candlestick charting for low risk, high probability trading programs. There is a good number of commodities to trade, each unrelated to the others. This creates the opportunity to find a clear cut, undeniably excellent buy or sell signal using candlestick charting most any time. No matter what the economic atmosphere prevails, there should be an excellent trade setup somewhere. The Candlestick Trading Forum will not always have a recommendation every day. But when all the parameters are aligned, making for that “perfect trade”, we will put out that recommendation.


Commodity Trading Package

Special presentation video by Stephen Bigalow on Introduction  to Trading Commodities(free video recorded at recent live webinar)

Education for Commodity and Futures Trading for Beginners –  10 Part Lesson

     Futures Trading for Beginners. Exactly what are futures, and how is it different from the stock market?
 
     Paper Trading Futures. Get your strategy down on paper and fully understand the potential of futures trading. Become comfortable with the terminology and select your software program.

       Balancing Risk and Reward.  The trades can be risky but the rewards can be very nice. So why the bad reputation?


     Factors to consider when choosing futures markets. Consider liquidity and be diversified.

 
      Do you have what it takes to Trade Futures? The necessary Traits to Trade Futures.
 
      Planning for Success. Set your Plan for Success
 
      Futures Orders Defined. What are MarketLimit, and Stop orders.
 
     Reading the Future with Japanese Candlesticks
 
     Futures Exchanges; know where you are doing business
 
    Futures Trading Advisors; Who is Going to Help YOU?

Candlestick Charts Provide Profitable Swing Trades

Learn CANDLESTICK TRADING with Stephen Bigalow via online webinar training sessions the perfect technical analysis tool for swing trading.


Swing Trading, a relatively popular trading technique. The advent of computers over the past seven to ten years has opened the opportunity for investors to trade stocks and other investments from their home or office. The vast improvement in charting services on the Internet now provides a method for individuals to take advantage of the quick fluctuations in stock prices. Swing trading provides investors a huge opportunity to make profits. As the market sentiments evolve, long term investing becomes less of a dominant form of investing. Swing trading has many advantages over long term investing, especially when implementing with a timing technique such as candlestick trading. Swing Traders will typically hold a particular stock for anywhere from a few days to a few weeks but trade on the basis of the stock’s intra-week or intra-month price changes.

Candlestick analysis has “common sense” built into its signals. Understanding the investor sentiment prepares the candlestick investor to maximize profits in short term swing trading. To get into a trade at the optimal point, anticipating when a trend is about to reverse, is crucial. Understanding how the common investor thinks and reacts permits fast profits to be made by swing trading.

When most trends reverse, they do so with vigor. The initial day or two of a trend reversal can produce magnificent profits. Swing trading is centered upon taking advantage of that initial move. If the trader has the tools to find and exploit these moves, swing trading becomes a profitable and comfortable form of extracting profits from the market. Our contention is that the candlestick signals ARE the tools needed.

Swing trading requires the alignment and concentration of events to maximize profits. Long-term investing does not require the stringent perusal of profit parameters. How often have you heard somebody rationalize about a setback in their position, “Oh well, I’m in it for the long term.” This statement is often uttered instead of taking a progressive stance towards one’s investment goals.

Swing trading represents the exact opposite. An investor trying to maximize profits from a two to ten day holding period has to have analyzed all elements. When swing trading, the establishment of a trade has to be exacting in its purpose, making a profit NOW in that trade.

The innate characteristics built into candlestick signals produce the parameters that make swing trading successful. The recognition of  pattern reversal in a trend can be visually depicted in the signals. For the aggressive swing trader, knowing how the signals are formed can produce trades that pinpoint the exact point in which to enter a trade. Additionally, the same indications that get the candlestick swing trader into a trade will alert the trader when it is time to get out.

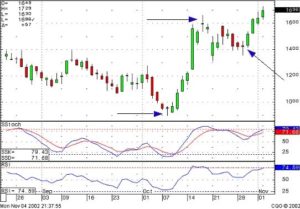
As seen in the following chart, notice the Doji signals at each turn. Knowing what to do after each signal creates the format for profitable swing trading. Knowing the simple rules about what to do once observing a Doji has the candlestick swing trader in and out of trades at the optimal points.

Swing%20Trading%20Chart%201%20copy

Swing Trading, Doji

Learning the methods to evaluate the signals makes swing trading an easy program to extract profits out of the market consistently. Candlestick signals provide two valuable facets. First, the signal searches locate the high potential profitable swing trades. The searches can be constructed to find the signals that occur at the best positions during a trend movement. Finding a candlestick buy signal when stochastics are oversold or searching for a gap up after a Doji are a couple of examples on how to fully utilize the search capabilities. The second facet is the pinpointing when to get into and out of a trade as explained earlier.

Swing trading concentrates on the alignment of parameters to maximize profits. The candlestick signals add the dimension of allowing successful trades to run, as well as showing when a trade has fizzled. The Candlestick Trading Forum specializes in identifying trades suitable for the swing trading investment community. Please review the services provided on the website. Swing trading lies at the core of Mr. Bigalow’s assertion that the candlestick signals can be traded to produce 10% per month return from the stock market. Join the community of traders that search, research and make available swing trading ideas on our Forum and Stock Chat Room.

The History of Japanese Candlesticks

Throughout Candlestick Analysis you are going to find many war-like references. Between 1500 and 1600 the territories of today’s Japan were at constant war. Each daimyo (feudal lord) was in constant contention to take over their neighbor. This one hundred year period is known as Sengoku Jidai or the “Age of Country at War”. This was a definite period of turmoil. It slowly came to order in the early 1600’s through three dynamic generals – Nobunaga Oda, Hideyoshi Toyotomi, and Leyasu Tokugawa. Their combined leadership prowess has become legendary folklore in Japan’s history. Their achievements are described as: “Nobunaga piled the rice, Hideyoshi kneaded the dough, and Tokugawa ate the cake.” All the contributions from these great generals unified Japan into one nation. Tokugawa’s family ruled the country from 1615 to 1867. This become known as the Tokugawa Shogunate Era.
While the Candlestick methodology was being developed, a military environment persisted in Japan.

Understandably, the Candlestick technique employs extensive military terminology for its explanations. Investing is correlated to battle. It requires the same tactical abilities to win. The investor has to prepare for winning trades as a general prepares for battle. A strategy is required, the psychology of coming events have to be thought through. Competition comes into play. Aggressive maneuvers and strategic withdrawals are required to eventually win the war – to achieve financial success.

As stability settled over the Japanese culture during the early 17th centuy, new opportunities became apparent also. The centralized government lead by Tokugawa diminished the feudal system. Local markets began to expand to a national scale. The demise of local markets created the growth of technical analysis in Japan.
Osaka became regarded as Japan’s capital during the Toyotomi reign. Its location near the sea made it a commercial center. Land travel was slow and dangerous, not to mention costly. It became a natural location for the development of the national depot system, assembling and disbursing supplies and market products. It rapidly evolved into Japan’s largest city of finance and commerce. Osaka, the “Kitchen of Japan” with its vast system of warehouses, eventually established an atmosphere of price stability by reducing regional imbalances of supply. Osaka became the profit center of all Japan, completely altering the normal social standards. In all other cities the quest for profits was despised. Japan was composed of four classes, the Soldier, the Farmer, the Artisan, and the Merchant. It was not until the 1700’s that the merchants broke down the social barrier. “Mokarimakka” which means ” are you making a profit?” is still the common greeting in Osaka today.

Under Hideyoshi’s reign, a man named Yodoya Keian become a successful war merchant. He had exceptional abilities to transport, distribute and set the price of rice. His reputation become so well known, his front yard become the first rice exchange. Unfortunately, he became very wealthy. Unfortunate because the Bakufu (the military government lead by the Shogun) relieved him of all his fortune. This was done based upon the charge that he was living a life of luxury beyond his social rank. This was during a period in the mid 1600’s when the Bakufu was becoming very leary of the merchant class. A number of merchants tried to corner the rice market. They were punished by having their children executed. They were exiled and their wealth was confiscated.

The Dojima Rice Exchange, the institutionalized market that developed in Yodoya’s front yard, was established in the late 1600’s. Merchants were now capable of grading the rice, and negotiated setting the market price. After 1710, actual rice trading expanding into issuance and negotiating for rice warehouse receipts. These become known as rice coupons, and were the first forms of futures. The Osaka rice brokerage became the foundation for the city’s wealth. 1,300 rice dealers occupied the Exchange. Due to the debasing of coinage, rice became the medium of exchange. A daimyo in need of money could send his surplus rice to Osaka and get a receipt from a warehouse. This receipt (coupon) could then be sold. As with many daimyo, cashflow problems could be eliminated through this method. Sometimes many future years of crops were mortgaged to take care of current expenses.

With the rice coupon becoming an actively traded entity, the Dojima Rice exchange became the world’s first futures exchange. Rice coupons were also called “empty rice” coupons, rice that was not in physical possession. Rice futures trading became so established in the Japanese marketplace, that in 1749, 110,000 bales (rice traded in bales) were freely traded while there were only 30,000 bales in existence throughout Japan.

It was during this time period that Candlestick trading became more refined. Candlestick analysis had been developed over the years simply due to the tracking of rice price movements. However, in the mid 1700’s they were really fully utilized. “The god of the markets” Homna came into the picture. Munehisa Homna, the youngest son of the Homna family, inherited the family’s business due to his extraordinary trading savvy. This at a time when the Japanese culture, as well as many other cultures, thought it common that the eldest son should inherit the family business. The trading firm was moved from their city, Sakata, to Edo (Tokyo). Homna’s research into historic price moves and weather conditions established more concrete interpretations into what became known as Candlesticks. His research and findings, known as “Sakata Rules” became the framework for Japanese investment philosophy.
After dominating the Osaka rice markets, Homna eventually went on to amass greater fortunes in the Tokyo exchanges. It was said that he had over one hundred winning trades in a row. His abilities became legendary and were the basis of Candlestick analysis.

Japanese Candlestick analysis was never a hidden or secretive trading system. In was successfully used in Japan for hundreds of years. It has been only recently, about 25 years ago, that it first made its way into the U.S. trading community. Until then, there just wasn’t any interest from Western cultures to investigate the Candlestick Technique. Even then, it was not noticed all that much. The perception has been that it was difficult to learn and very time consuming. That may have been true until recently. The first books introducing it into the U.S. trading arena would describe how to make wooden boxes that were backlit. Then the chart graphs could be better viewed. Fortunately, the advent of computers and computer programming has taken Candlestick analysis ahead by leaps and bounds.
Until recently, the investment community knew about Candlesticks, they just didn’t know how to use them effectively. Interest has been increasing dramatically now that the roaring markets have collapsed. Investors, new and old, are now trying to investigate methods that protect them from the severe losses that occurred from March 2000 until now.
Hundreds of years of analysis and interpretation can be much more easily extracted through computer programming. Huge fortunes were amassed with simple charting techniques. The same will be true with all the benefits that computer software provides the investor today.

The interest in candlestick signal analysis in the United States has to be credited to Steve Nison. Over three years of extensive research produced Steve Nison’s initial publication “Japanese Candlestick Charting Techniques”, published in 1991. Much of the background and historical information about candlesticks, found in this site and many other sites, was probably the results of Steve Nison’s excellent research.

Stephen W. Bigalow – Director and Editor of The Candlestick Trading Forum

Bigalow Bio Photo Stephen W. Bigalow possesses over twenty-five years of investment experience, including eight years as a stockbroker with major Wall Street firms: Kidder Peabody & Company, Cowen & Company and Oppenheimer & Company. This was followed by fifteen years of commodity trading, overlapped with twelve years of real estate investing. He holds a business and economics degree from Cornell University, and has lectured at Cornell and at many private educational investment functions over the past twenty years.

Mr. Bigalow has advised professional traders, money managers, mutual funds and hedge funds, and is recognized by many in the trading community as the “professional’s professional.” He is an affiliate of the “Market Technicians Association”. (mta.org – A non-profit association of professional technical analysts) and a member of AAPTA, the American Association of Professional Technical Analysts. (aapta.us)

Learn JAPANESE CANDLESTICKS with Stephen Bigalow via online webinar training sessions

Mr. Bigalow has advised professional traders, money managers, mutual funds and hedge funds, and is recognized by many in the trading community as the “professional’s professional.” He is an affiliate of the “Market Technicians Association”. (mta.org – A non-profit association of professional technical analysts) and a member of AAPTA, the American Association of Professional Technical Analysts. (aapta.us)

Learn JAPANESE CANDLESTICKS with Stephen Bigalow via online webinar training sessions.

His first book, Profitable Candlestick Trading: Pinpointing Market Opportunities to Maximize Profits, published by John Wiley & Sons, hit the market in January 2002. The book is directed towards the new investor all the way up to the most sophisticated professionals. It is written in a manner that easily demonstrates the wealth of information, about price movement and the investor psychology, built into the Candlestick signals. He emphasizes the fact that investors, especially the unsophisticated investor, can extract information from the signals. This information, filled with common sense investment principles, greatly expands an investors perspective. Reading the book eliminates the need to depend on investment professionals. Click here, Profitable Candlestick Trading, to find out more about the book.

Mr. Bigalow’s second book, High Profit Candlestick Patterns: Turning Investor Sentiment into High Profits, published by Profit Publishing, was released in December 2005. This book takes trading  to the next level, combining the proven results of Japanese Candlestick charting with effective Western technical analysis. The self-mastery of profitable investing is simplified with quick visual evaluations. Click here, High Profit Candlestick Patterns, for details.

His experience with Candlesticks started over fifteen years ago. This was approximately the time that  Candlesticks were first introduced into the United States. This extensive experience has been channeled into a concise and effective training procedure. Fifteen years of learning from mistakes and avoiding the potential pitfalls are consolidated into an easy to follow, comprehensive training program.

Throughout his investment career, Mr. Bigalow has directed his investment acumen towards developing improved methods for extracting profits from the investment markets. His research, encompassing all fundamental and technical methods, resulted in verifying that Candlestick analysis was superior to any other method. In consulting with money management and energy trading firms, he has successfully combined conventional research methods with Candlestick analysis to greatly enhance investment returns. His implementation of statistical analysis with the Japanese Candlestick methodology has produced some unique successful trading programs.

Mr. Bigalow has also played a role in creating effective methods for learning “how” to use Candlestick signals profitably. There are excellent books on the market describing Candlestick formation. The Candlestick Trading Forum was established to use that information to trade the signals profitably.