Stock market traders and investors use a firm knowledge of stock fundamentals as their basic tool in stock market investing, day trading, and trading stock options. The review and study of stock fundamentals is referred to as fundamental analysis and differs from technical analysis as an approach to trading or investing in the stock market. Stock fundamentals focus on the financial health and growth prospects of a company that issues stock. Investors will want to be assured of the competence and vision of the company’s management as well as the company’s competition in the market sectors in which it operates. Stock fundamentals include the company’s financial statements, especially its cash reserves and other assets which will provide the company with a margin of safety in the event of an economic downturn. The primary concern in long term investing is intrinsic stock value. This is the discounted forward looking income stream of the company. Although fundamental analysis focuses these issues the investor is wise to use technical analysis tools such as Candlestick pattern formations when buying stock and selling stock in order to optimize purchase and sale prices.
An investor studies stock fundamentals in order to add high value stocks to his stock portfolio. Part of the value of the stock to the investor is its current price. A well run and growing company with excellent products and profits will often sell at what seems to be a premium to other stocks in its market sector. It will commonly have a high price to earnings ratio. In other words investors buy the stock, at a high price, because the rest of the market is doing so. This psychology of investing often leads investors into paying too much for a stock and, thus, diluting their long term profits. By using both fundamental and technical analysis the savvy investor will study stock fundamentals to discover long term value. Then he will follow the market price of the stock with Candlestick analysis and profit from buying at the bottom of a stock price correction or market reversal due to a hiccup in the business cycle.
When an investor buys a promising stock based upon strong stock fundamentals his analysis of that stock should not stop. A smart investor will routinely reassess the fundamentals of stocks in his portfolio and will sell those that be come “under performers.” Additionally in investor will remain aware of technical market factors with the use of Candlestick charting. When an investor has made really good stock picks the stock prices on his stocks may rise rapidly, too rapidly. Such hot stocks often experience a “correction” on their way up. When the investors knows that the stock fundamentals on these stocks are still strong he will not want to sell these stocks for a profit but he will also not want to see part of his investment lost when the stock price corrects. By skillful reading of Candlestick patterns an investor can often anticipate the point at which the stock price will correct. By buying puts on the stock he will be able to insure that he gets the current stock price on a sale even if the market corrects. In fact, he will sell at the current price and then buy again after the stock price as dropped in the correction.
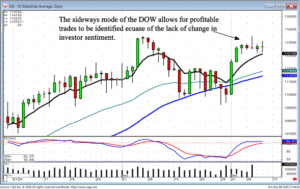
Being able to accurately analyze the market conditions provides a huge advantage. After a bullish start just over a week ago, the Dow has gone flat the past five trading days. This became relatively evident after the second flat day. It produced a chart that could predict sideways movement in the markets until the T-line caught up. Is a flat trading market detrimental? Definitely not, there will continue to be prices moving relatively strong one way or the other in a flat market. The advantage we have with candlestick analysis is having the visual ability to see which charts are still showing strong price patterns. A breakout from a price pattern is still going to produce significant profits in spite of the fact the market in general is trading sideways.

DOW
When the T-line is trying to catch up with a sideways moving trend, there are expectations when they do come together. Many investors will witness the support at a specific moving average and start buying.
Being able to take advantage of what the charts are revealing allows investors to continue to make good profits when many other investors are waiting for the market to break out of the sideways mode. A sideways moving market as one obvious feature. It demonstrates there has not been a change of investor sentiment. That knowledge allows an investor to continue to participate in patterns that will perform well provided there is not a severe change of investor sentiment. This ability puts the candlestick investor at a great advantage. Positive returns are not dictated by the direction of the market. Positive returns can continue to be made during all conditions of a market trend. Candlestick price patterns have inherent strengths that have created the pattern in the first place. These reoccurring price movements occur because of reoccurring investor sentiment.
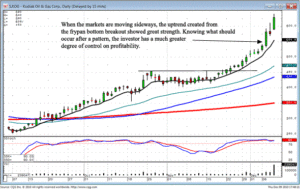
For example, the trend of KOG is a direct result of what should occur after a frypan bottom pattern breakout. In this case, the frypan bottom pattern acted as wave two in a three wave trend. The past week has shown flat trading in the Dow as well as the other indexes. However, the result of a frypan bottom breakout is a strong uptrend. When the market in general was trading flat for the past five trading days, this stock price has built up the enthusiasm that is usually associated with the end of wave three. Recognizing candlestick signals and patterns puts investors in situations where the probabilities are greatly in their favor.

KOG
The price trend seen in KOG had a high probability of occurring based upon the frypan bottom pattern. To disregard the basic results of candlestick signals is to put one’s self against the probabilities. Very simple scanning techniques allows an investor to identify which stocks have the best potential. The application of candlestick formations makes it much more clear to identify where a bullish or bearish breakout should occur. This capability reduces the risk and dramatically improves the probabilities of being in the right position at the right time. The CandlestickForum is providing a training program on December 14, Tuesday night, to demonstrate simple scanning techniques that exposes the best trading potentials. Please review this mini-training session information on the home page, or click here for more info.
Chat session tonight at 8 PM ET . Learn some of the basics on how to identify where the next big trade is going to occur.
The Candlestick Forum Team


HOLIDAY SPECIALS FOR THE INVESTOR WHO HAS EVERYTHING
HOLIDAY GIFT PACKAGES
Profitable Candlestick Trading
Candlestick Signal Flash Cards
Major Signals Mouse Pad
Gift Membership Subscriptions
Website special reflects current newsletter. If you are reading an archived newsletter you will be directed to Current Website Special
Speak Your Mind