Investors will demand a risk premium when taking on an investment with a measurable possibility of failure. A common explanation of risk premium is that it is the minimum amount of return on investment that a risky investment must produce when compared to a risk free investment. The investor accepts investment risk in return for a larger possible return on investment . For those totally averse to taking on risk there is the certainty equivalent which is guaranteed return one would demand in return for taking on a risk free investment. United States T-Bills are generally considered to be risk free investments. Thus the premium that investors require for a risky investment is typically the return offered by the risky investment minus the return on a Treasury bill.
Another way of viewing the risk premium is that it is the excess rate of return demanded by investors for taking on the risk of loss. In finding profitable investments one may look to stocks with more risk than one normally accepts. In accessing risk and required risk premium in long term investing or short term trading fundamental analysis is essential. Traders will follow market sentiment with Candlestick analysis and profitably trade market volatility . However, it is a collapse of fundamentals that commonly drives a company into bankruptcy or causes a payer to default on bond payments.
Choosing a number of such stocks in a stock portfolio spreads the investment risk . Taken to a much larger scale this is the theory behind junk bond funds. Because the risk premium is large for risky bonds a well chosen group of junk bonds can often outperform higher grade bonds as the higher rate of return more than makes up for defaults in the portfolio. The risk premium for stocks is determined by the stock market as investors and traders will not buy stocks unless the risk premium outweighs the perceived degree of risk.
Risk premium is largely a concern of long term investing as day trading concerns itself with short term stock price movement. For the day trader the fundamentals that determine risk premium are factored into the stock price as soon as they are known. Using Candlestick charting techniques traders can buy stock , sell stock , and sell short profitably by accurately reading market sentiment.
Although the trader is more concerned with technical analysis with Candlestick charting than with strict fundamental analysis he still must keep in touch with the fundamentals. Fundamentals not only drive stock price directly but they drive market sentiment as the stock market news tweaks the psychology of investing and trading in the unwary. Here is where stick adherence to Candlestick patterns benefits the investor and trader. When a Candlestick signal presents itself it tells the trader or investor that a high probability exists that a stock price will react in a specified manner. The trader or investor need only put his ego aside and follow his Candlesticks to improve his chances of profit. A this time risk premium is not the issue as the centuries of market experience distilled into Japanese Candlestick signals lights the way to profits.
Market Direction
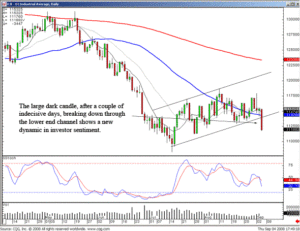
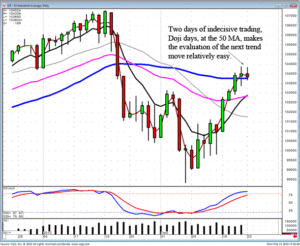
The Dow closed right on the T-line today. The NASDAQ and the S&P 500 closed just slightly above the T-line but each formed a Doji. When analyzing a situation where the close is just above the T-line, it is important to take into consideration what type of candlestick formation was created. Because the NASDAQ and the S&P 500 showed indecisive trading just above the T-line, it will still be important to see how the markets open tomorrow. A higher open would indicate the trend is moving above the T-line. A lower open will indicate the T-line area was still acting as resistance, the down trending channel will still be affecting the trend.
Chat session tonight at 8 PM ET- guest speaker -Tina Logan -one of the leading investment trainers in the nation – join us tonight as Tina will illustrate specific techniques on how to be mentally prepared for successful trading.
2-Day Candlestick Analysis Training – Once the major candlestick signals are identified and understood, applying techniques to your trading will allow for a dramatically improved correct trade ratio. This today training session provides additional insights in how the major signals can be used successfully for identifying high profit patterns, effective entry and exit strategies, the correct stop loss procedures, accurate trend analysis, utilizing moving averages, trend lines, and Fibonacci numbers to further enhance correct trade probabilities.
Additional information about how to keep your emotions out of your investment decisions will be incorporated throughout this training process. Do not miss this opportunity to assemble the knowledge of candlestick analysis into a logical and easy to understand process. Discover how to utilize the information built into candlestick signals to understand price movements that takes most experienced investors decades to perfect. Click here for training information.
Good Investing,
The Candlestick Forum Team
Scanning Tchniques Quick Download
Website Special reflects current newsletter. If you are reading an archived newsletter you will be directed to Current Website Special


