Successful technical stock traders commonly use stock trading signals to profitably buy stock and sell stock. This is the practice of technical analysis which seeks to predict stock price direction based upon past stock prices and stock trading volume. Stock trading signals are effective because stock market history repeats itself, the market effectively discounts stock fundamentals, and the psychology of investing is a major price mover. Using the stock trading signals in Candlestick analysis helps traders to profitably anticipate a market rally, market reversal, and tell if market trends will continue.
The investor may claim that stock fundamentals alone drive stock prices. Certainly, long term investing relies heavily on fundamental analysis of stocks. However, obtaining the best price in selling stock or buying stock is best accomplished with stock trading signals such as Candlestick patterns. Although the price of a stock is driven long term by its fundamentals it is the psychology of trading, as well as investing, that moves prices minute by minute. Combining fundamental and technical analysis as seen in stock trading signals are both necessary ingredients to success in buying and selling stocks.
Traders use stock trading signals to find recognizable, and repeating, price patterns. These patterns happen because of changes in stock fundamentals, the economy, and market psychology. However, the trader commonly does not need to be a market psychologist, an economist, or expert on stock fundamentals in order to see a pattern in Candlestick charting. Because patterns are repetitive the trader knows that the first part of a pattern predicts the last part. Part of the skill set of an accomplished technical trader is to know when to interpret and act upon an evolving pattern. Wait too long and the anticipated price movement has already happened before you can profitably trade. Jump too soon before the pattern is clear and you might just have executed a losing trade. Take online classes, trading in simulation, and studying Candlestick basics will help the trader hone his skills in the effective use of stock trading signals.
Besides following price patterns, stock traders use information on trading volume as well as information on options trading as stock trading signals. Trading volume often precedes stock price movement. When a trader sees that options investors are buying calls much more than buying puts they can safely assume a positive investor sentiment regarding a given stock. The trader will then follow the stock price pattern to determine if a substantial price change is likely and it what direction it is likely to happen. A trader using trading signals will also look at investor sentiment. When everyone believes a stock will keep going up in price it often means that most have already purchased the stock. That leaves few new buyers on the sidelines ready to buy and drive the price up. When a trader sees this signal he may watch price patterns looking for hints of price volatility and of a price decline. The ability to profitably read and execute trades based on stock trading signals increases with time, study, and practice.
What sectors are going to be the strongest next year? That is the question every investor is trying to analyze during the holidays. Obviously the trading slows down starting a few days before Christmas and the week before New Year’s. This is a time when most investors can assess what they did wrong or what they did right during the past year. This self-evaluation is usually directed more toward the individual investor. We want to learn what we did wrong so we can correct it going into the next year. This is a great advantage when using candlestick signals. We can graphically review what occurred in prices and evaluate what we should have done to make the returns better. Most trading methods do not allow for the self review.
The visual aspects of candlestick analysis also demonstrates what the big money managers are anticipating. Do you know which sectors of the market are going to be the strongest right after the first of the year? Probably not! Unless you have the mental capability of analyzing the dynamics of all aspects of the economic arena, you will probably have no idea which sector or sectors are going to have the best potential. However, candlestick analysis allows the individual investor to see what the investment decisions are of the big money managers. It is safe to assume that a large money manager is going to have numerous analysts and staff members analyzing world market conditions and what those conditions will do to individual sectors. Unless you have a huge research fund for acquiring that information yourself, more than likely investment firms will already be doing that type of research. As a candlestick investor, it becomes much easier to identify what the cumulative knowledge of all the money managers is doing. This makes the investment strategy very simple.
The sentiment of the big money managers can be evaluated as to their bullish or bearish outlook going into the new year. Candlestick signals will indicate which direction the initial investor sentiment will take the market. Next, candlestick signals an individual stock sectors will demonstrate where the big money anticipates the best returns for the year. Why will this become so evident on the first day of trading? Just like ourselves, the holiday weeks provide ample time to evaluate for the big money manager to fully assess what is going to produce the best profits for their fund in the coming year. When their livelihood depends greatly upon their analytical capabilities, it can be assumed they have fully researched what particular what particular conditions will do to particular markets.
Not only will the direction of the market be easily evaluated but the identification of individual sectors will stand out immediately. This will be the result of a couple of weeks of assessment and reassessment of money managers portfolios. They will want to get into the sectors they deem as the best potential for the coming year. These will be easily seen based upon the candlesticks.
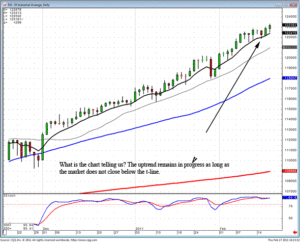
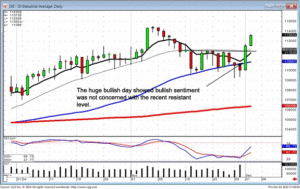
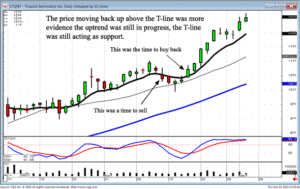
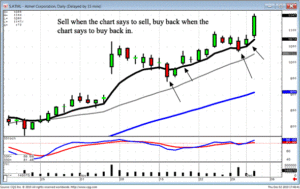
The current market trend continues to show a slow uptrend without evidence of any major selling pressure. There are particular sectors that have been producing good steady profits during this uptrend. Maintaining those positions have been dramatically profitable due to some very simple trend analysis. For most profitable positions, as long as a candlestick sell signal was not confirmed with a close below the tee line, the uptrend was considered to be still in progress.
The investment strategy at this point should be the liquidation of positions that are showing some weakness. Adding to the cash position will allow investors to participate in the high profit/high-powered moves that should occur right after the first of the year.
Chat session tonight at 8 PM ET.


HOLIDAY SPECIALS FOR THE INVESTOR WHO HAS EVERYTHING
Profitable Candlestick Trading
Candlestick Signal Flash Cards
Major Signals Mouse Pad
Current Website Special
Trading Options
Website special reflects current newsletter. If you are reading an archived newsletter you will be directed to Current Website Special
