![]() Futures Trading for Beginners. Exactly what are futures, and how is it different from the stock market?
Futures Trading for Beginners. Exactly what are futures, and how is it different from the stock market?
![]() Paper Trading Futures. Get your strategy down on paper and fully understand the potential of futures trading. Become comfortable with the terminology and select your software program.
Paper Trading Futures. Get your strategy down on paper and fully understand the potential of futures trading. Become comfortable with the terminology and select your software program.
![]() Balancing Risk and Reward. The trades can be risky but the rewards can be very nice. So why the bad reputation?
Balancing Risk and Reward. The trades can be risky but the rewards can be very nice. So why the bad reputation?
![]() Factors to consider when choosing futures markets. Consider liquidity and be diversified.
Factors to consider when choosing futures markets. Consider liquidity and be diversified.
![]() Do you have what it takes to Trade Futures? The necessary Traits to Trade Futures.
Do you have what it takes to Trade Futures? The necessary Traits to Trade Futures.
![]() Planning for Success. Set your Plan for Success
Planning for Success. Set your Plan for Success
![]() Futures Orders Defined. What are Market, Limit, and Stop orders.
Futures Orders Defined. What are Market, Limit, and Stop orders.
![]() Reading the Future with Japanese Candlesticks
Reading the Future with Japanese Candlesticks
![]() Futures Exchanges; know where you are doing business
Futures Exchanges; know where you are doing business
![]() Futures Trading Advisors; Who is Going to Help YOU?
Futures Trading Advisors; Who is Going to Help YOU?
Education for Commodity and Futures Trading for Beginners – 10 Part Lesson
Best Trading Practices
Profitable stock trading over the long term does not come from luck. It does not come from stock tips. Profitable stock trading is the result of applying the best trading practices to stock trading. Profits come from using the best trading practices day in and day out for weeks, months, and years. Best trading practices include technical analysis of stocks with profitable trading tools like Candlestick analysis as well routine fundamental analysis to identify a stock’s margin of safety and intrinsic stock value. Best trading practices may vary from stock trader to stock trader, depending upon whether the trader is seeking profits in options trading, scalping profits from movements in stock price, or employing other trading strategies. No matter what strategy and tactics traders choose to employ, best trading practices will include the routine review of trading results in order to identify what works and what does not. Profit comes from a sound trading strategy and greater profit comes from a continuously improved trading strategy.
Because stock price patterns repeat themselves the alert trader using technical analysis tools like Candlestick pattern formations can profitably anticipate changes in stock prices. The underlying reasons for why stock price patterns develop vary according to market conditions. Part of a pattern will be due to stock fundamentals and part will be due to market reaction. The technical trader will always be wise to be aware of the fundamentals driving a stock price. However, his best trading practices will typically revolve around trading according to technical analysis of Candlestick patterns. These easy to recognize stock trading signals have been around for centuries, having evolved in commodities trading of rice in ancient Japan. These representations of stock price patterns are excellent predictors of market trends as well as market reversal.
They are equally useful in trading futures, commodities, stocks, options, and Forex.
Although there are best trading practices applicable to direct stock trading, options trading, or futures trading there are also best trading practices principles that apply to changing tactics as market conditions vary. For example, a trader may find profits in scalping in a market that is in an upswing but has a fair amount of stock volatility. However, if the volatility becomes extreme the trader may switch to options trading in order to reduce investment risk while still using Candlestick chart analysis to predict price movement and gain profits. Using strategies such as a long straddle the trader can buy both a call and a put on the same stock with the same options expiration date. In such a way he will profit if the stock goes up or down and will limit his risk to the price of there premiums paid.
A trader’s best trading practices will be those that work the best for him. Taking time to learn about individual stocks or about new stock trading tactics is a basic necessity for successful trading. Learning how to trade individual stocks while still maintaining a broader view of the stock market is one of the best trading practices as it will continually help the trader find the next profitable trading opportunity even as he is executing trades on the current one. Because none of us is perfect we all make mistakes. It is through the review of trading results that traders learn and continually improve trading profits.
Understanding the underlying forces that are involved with the creation of candlestick reversal signals becomes an extremely important factor for analyzing a market trend. The signals demonstrate the bias of investor sentiment. Utilizing this information allows for a much more comfortable trading process for the candlestick investor. There will always be times when prices appear to be going against what the predominant signal has revealed. Stepping back and analyzing which signal is still the predominant signal will allow an investor to make entry and exit decisions more accurately. A price trend is not always going to go in one direction without some waffling. Understanding which signal is still the predominant signal keeps an investor from exiting a trade too early.
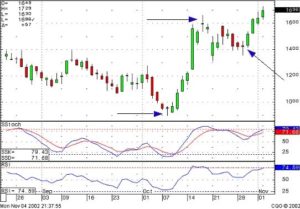
The April Live Cattle chart demonstrates how respecting the latest candlestick signal can keep an investor from exiting a trade too early. The Evening Star/Bearish Engulfing signal, that closed below the T-line, was considered the predominant signal. Monday’s trading would have been very uncomfortable for the short positions that had shorted based upon the candlestick sell signal. As can be seen, the following three days after the big sell signal, investor sentiment was indecisive. However, there was nothing that indicated the sell signal was still not the predominant analytical factor. Today’s trading saw bullish trading early in the day. Unless today’s trading finished very strong, nothing yet had changed the message conveyed from the large sell signal. The Evening Star signal would have been negated had today’s trading closed more than halfway up the large bearish candle.
Live Cattle April
Before the end of the day, the buying disappeared and the sellers came back. This obviously continued the downtrend. Suspecting the downtrend was not over at least allowed an investor to decide that if they covered their short positions, they should be prepared to reestablish the position if the selling became evident again. There are a number of simple common sense nuances associated with candlestick analysis that can greatly improve how an investor interprets a price trend.
The Dow made a strong showing today, closing above the T-line. Visually analyze the Dow as a possible J-hook type pattern. This provides evidence the uptrend may still be in progress for a few more weeks. The NASDAQ is showing the same strength, but on different days. The combination of the two indexes provide a good indication to be relatively bullish in the portfolio. Where many analysts are advising to be cautious, thus limiting the potential gains of a bullish trend, candlestick analysis more clearly reveals the direction of the market. This allows for establishing positions in the portfolio with more confidence.
DOW
There are many aspects to candlestick analysis that diminish the emotions involved with trading. Once an individual understands the benefits of candlestick signals information, they can trade with more confidence and react less to outside factors that play more upon investors emotions than they do the reality of price moves.
Chat session tonight at 8 PM ET.
Good Investing,
The Candlestick Forum Team
Candlestick Profits – Eliminating Emotions With Candlestick Analysis
PCF (Personal Criteria Formulas) For TeleChart Software
PCF’s written in TeleChart searches for The Major Candlestick Signals
The following criteria for Major Candlestick Signals is provided for your convenience. Follow TeleChart instructions for adding search criteria, then ‘cut-and-paste’ the formulas below.
You will also find these posted in the Candlestick Forum club on TeleChart. Join Steve and fellow candlestick traders by adding the Candlestick Forum club to your directory.
Doji
(O = C )
Doji Yesterday
(O1 = C1 )
Doji and Near Doji
(ABS(O – C ) <= ((H – L ) * 0.1))
Bullish Engulfing
((O1 > C1) AND (C > O) AND (C >= O1) AND (C1 >= O) AND ((C – O) > (O1 – C1)))
Bearish Engulfing
((C1 > O1) AND (O > C) AND (O >= C1) AND (O1 >= C) AND ((O – C) > (C1 – O1)))
Hammer
(((H-L)>3*(O-C)AND((C-L)/(.001+H-L)>0.6)AND((O-L)/(.001+H-L)>0.6)))
Hanging Man
(((H – L) > 4 * (O – C)) AND ((C – L) / (.001 + H – L) >= 0.75) AND ((O – L) / (.001 + H – L) >= .075)))
Piercing Line
((C1 < O1) AND (((O1 + C1) / 2) < C) AND (O < C) AND (O < C1) AND (C < O1) AND ((C – O) / (.001 + (H – L)) > 0.6))
Dark Cloud
((C1 > O1) AND (((C1 + O1) / 2) > C) AND (O > C) AND (O > C1) AND (C > O1) AND ((O – C) / (.001 + (H – L)) > .6))
Bullish Harami
((O1 > C1) AND (C > O) AND (C <= O1) AND (C1 <= O) AND ((C – O) < (O1 – C1)))
Bearish Harami
((C1 > O1) AND (O > C) AND (O <= C1) AND (O1 <= C) AND ((O – C) < (C1 – O1)))
Morning Star
((O2>C2)AND((O2-C2)/(.001+H2-L2)>.6)AND(C2>O1)AND(O1>C1)AND((H1-L1)>(3*(C1-O1)))AND(C>O)AND(O>O1))
Evening Star
((C2 > O2) AND ((C2 – O2) / (.001 + H2 – L2) > .6) AND (C2 < O1) AND (C1 > O1) AND ((H1 – L1) > (3 * (C1 – O1))) AND (O > C) AND (O < O1))
Bullish Kicker
(O1 > C1) AND (O >= O1) AND (C > O)
Bearish Kicker
(O1 < C1) AND (O <= O1) AND (C <= O)
Shooting Star
(((H – L) > 4 * (O – C)) AND ((H – C) / (.001 + H – L) >= 0.75) AND ((H – O) / (.001 + H – L) >= 0.75)))
Inverted Hammer
(((H – L) > 3 * (O – C)) AND ((H – C) / (.001 + H – L) > 0.6) AND ((H – O) / (.001 + H – L) > 0.6)))
Recent Formulas Submitted by our Candlestick Forum Members
These have not been tested by the CandlestickForum
J-Hook Pattern
((L1 = MINL4) OR (L2 = MINL4) OR (L3 = MINL4) ) AND
( (MAXC3 < MAXC4.3)) AND
( (H3 = MAXH15.4) OR (H4 = MAXH15.4) OR (H5 = MAXH15.4) OR (H6 = MAXH15.4) OR (H7 = MAXH15.4) ) AND (((MAXH4.3 – MINL4) / (MAXH4.3 – MINL21.3) > .23) AND ((MAXH4.3 – MINL4) / (MAXH4.3 – MINL21.3) < .62) ) AND
((AVGH3.5) > (AVGH3.8 ) AND (AVGH3.8 ) > (AVGH3.13) AND (AVGH3.13) > (AVGH3.18 ))
Belt Hold
C > O
AND L = MINL10
AND ((C – O) / (H – L)) > .5
AND ((C1 – L) / (H – L) > .6)
AND (H – L) > .2 * ((H5 – L5) + (H4 – L4) + (H3 – L3) + (H2 – L2) + (H1 – L1))
AND H > L1 AND C < H1
Belt Hold
(C > O) AND (H > L1) AND (L = MINL10) AND
((C – O) / (H – L) > .5) AND
(ABS(C1 – L) / (H – L) > .5) AND
( (H – L) > (((H – L + ABS(C1 – H) + ABS(C1 – L)) / 2 + (H1 – L1 + ABS(C2 – H1) + ABS(C2 – L1)) / 2 + (H2 – L2 + ABS(C3 – H2) + ABS(C3 – L2)) / 2 + (H3 – L3 + ABS(C4 – H3) + ABS(C4 – L3)) / 2 + (H4 – L4 + ABS(C5 – H4) + ABS(C5 – L4)) / 2) / 5))
Three Outside Down Pattern
((C2>O2)AND(O1>C1)AND(O1>=C2)AND(O2>=C1)AND((O1-C1)>(C2-O2))AND(O>C) AND (C
Three Outside Up Pattern
((O2>C2)AND(C1>O1)AND(C1>=O2)AND(C2>=O1)AND((C1-O1)>(O2-C2))AND (C>O)AND (C>C1))
Three Inside Up Pattern
((O2>C2)AND(C1>O1)AND(C1<=O2)AND(C2<=O1)AND((C1-O1)<(O2-C2))AND(C>O)AND(C>C1)AND(O>O1))
Three Inside Down Pattern
((C2>O2)AND(O1>C1)AND(O1<=C2)AND(O2<=C1)AND
((O1-C1)<(C2-O2))AND(O>C)AND(C>C1)AND (O< p=””><>
Three White Soldiers PCF
(C>O*1.01) AND(C1>O1*1.01) AND(C2>O2*1.01) AND(C>C1) AND
(C1>C2) AND(OO1) AND(O1O2) AND
(((H-C)/(H-L))<.2) AND(((H1-C1)/(H1-L1))<.2)AND(((H2-C2)/(H2-L2))<.2)
Three Black Crows PCF
(O > C * 1.01) AND (O1 > C1 * 1.01) AND (O2 > C2 *
1.01) AND (C < C1) AND (C1 < C2) AND (O > C1) AND (O < O1) AND
(O1 > C2) AND (O1 < O2) AND (((C – L) / (H – L)) < .2) AND
(((C1 – L1) / (H1 – L1)) < .2) AND (((C2 – L2) / (H2 – L2)) < .2)
SIMPLE MOVING AVERAGE SCANS
Crossing Up Through 50SMA (you may replace the 50 with other MA’s)
AVGC50 <= H AND AVGC50 >= L
Price under 50 Moving Average Yesterday – Over 50 Moving Average Today
C > AVGC50 AND C1< AVGC50
Bounce off 50MA Yesterday
AVGC 50.1 <= H AND AVGC50.1 >= L AND C > C1 AND C > AVGC50
Price Crossing over the 50MA and 20MA Today
(C > AVGC50 AND AVGC20 ) AND (C1 < AVGC50.1 AND AVGC20.1 )
Crossing Up Through 200SMA
AVGC200<=H AND AVGC200>=L
Stochastics Moving Up Through 20
STOC12.3.1 < 20 AND STOC12.3 > 20
April 2007 -New Formulas submitted by fellow Candlestick Forum Members for TeleChart Users
Thanks to everyone who emails their formulas on Candlestick Personal Criteria Formulas. These are not tested by us and provided as a courtesy. Please contact the Worden Brothers at Telechart2007 for all pcf support.
BULLISH PATTERNS
Abandoned Baby
C2
H1>L2 AND
(C1+O1)/2>=((H1+L1)/2)*0.40 AND
(C1+O1)/2<=((H1+L1)/2)*0.60 AND
ABS(C1-O1)<= (H1-L1)*10 AND
L>H1 AND
C
*Sort in ascending order*
Breakaway
C4
C3
C>O AND
C>H3
*Sort in ascending order*
Concealing Baby Swallow
O3=H3 AND
C3=L3 AND
O2=H2 AND
C2=L2 AND
C1
O=H AND
C=L AND
H>H1 AND
L
*Sort in ascending order*
Doji Star
C1
L>H1 AND
ABS(C-O)<= (H-L)*0.05 AND
((C+O)/2)-L >= (H-L)*0.40 AND
((C+O)/2)-L <= (H-L)*0.60
*Sort in ascending order*
Hammer/Dragonfly Doji
((((CO)*O))*(-1))-L>=(H-L)*0.75 AND
(H-L)>(AVGH21-AVGL21)
*Sort in ascending order*
Harami Cross
ABS(C1-O1)>(H1-L1)*0.50 AND
C1
(((C+O)/2)-L) > (H-L)*0.40 AND
(((C+O)/2)-L) < (H-L)*0.60 AND
ABS(C-O) < (H-L)*0.20
*Sort in ascending order*
Homing Pigeon
C1
ABS(C1-O1)>(H1-L1)*0.50 AND
H
C
*Sort in ascending order*
Inverted Hammer/Gravestone Doji
ABS(C-O) <= (H-L)*0.25 AND
((C+O)/2) – L <= (H-L)*0.25 AND
H-((C+O)/2)>= (((C+O)/2)-L)*0.34
Ladder Bottom
O4>C4 AND
O3
C>O AND
O>O1
*Sort in ascending order*
Mat Hold
C4>O4 AND
ABS(C4-O4)>(H4-L4)*0.50 AND
C3
C2>L4 AND
C1>L4 AND
C>C4 AND
C>O AND
(H-L)>(AVGH21-AVGL21) AND
C2
ABS(C2-O2)<= ABS(C4-O4)*0.75 AND
ABS(C2-O2)<= ABS(C4-O4)*0.75
*Sort in descending order*
Matching Low
(C1ABS(C1-O1)>(H1-L1)*0.50 AND
C
*Sort in ascending order*
Meeting Lines
C1
O1
CC>C1*0.99
*Sort in ascending order*
Rising Three Methods
(C4>O4) AND
(H4-L4)>(AVGH21.4-AVGL21.4) AND
C2
ABS(C3-O3)<=ABS(C4-O4)*0.75 AND
ABS(C2-O2)<= ABS(C4-O4)*0.75 AND
ABS(C2-O2)<= ABS(C4-O4)*0.75 AND
C>O AND
(H-L)>(AVGH21-AVGL21) AND
C>C4
*Sort in descending order*
Stick Sandwich
C2
L1>C2 AND
C
C
*Sort in ascending order*
Three Inside Up
ABS(C1-O1) >= (H2-L2)*0.70 AND
ABS(C2-O2)>(H2-L2)*0.50 AND
C1>O1 AND
C2
C>O AND
C>C1
*Sort in ascending order*
Three Outside Up
ABS(C2-O2)>(H2-L2)*0.50 AND
C2
O1
C>C1
*Sort in ascending order*
Tweezer Bottom
L=L1 AND
ABS(C-O)ABS(C1-O1)>=(H1-L1)*0.90 AND
(H1-L1)>=(AVGH20-AVHL20)*1.3
*Sort in ascending order*
BEARISH PATTERNS
Advance Block
(H-L)>(AVGH21-AVGL21) AND
ABS(C1-O1)>(H1-L1)*0.50 AND
ABS(C2-O2)>(H2-L2)*0.50 AND
C>C1 AND
C1>C2 AND
O1> O2 AND
O1< C2 AND
O>O1 AND
O
(H1-L1) < (H2-L2)*0.80 AND
(H-C)>(O-L) AND
(H1-C1)>(O1-L1)
*Sort in descending order*
Belt Hold
C>O AND
C>H*0.98
*Sort in descending order*
Breakaway
ABS(C4-O4)>(H4-L4)*0.50 AND
C4>O4 AND
C3>O3 AND
L3>H4 AND
C2>C3 AND
C1>C2 AND
C
*Sort in descending order*
Dark Cloud Cover
ABS(C1-O1)>(H1-L1)*0.50 AND
C1>O1 AND
O>H1 AND
C<((C1+O1)/2) AND
C>O1
*Sort in descending order*
Deliberation
ABS(C2-O2)>(H2-L2)*0.50 AND
ABS(C1-O1)>(H1-L1)*0.50 AND
C1>C2 AND
C2>O2 AND
C1>O1 AND
O>H1 AND
(((C+O)/2)-L) > (H-L)*0.40 AND
(((C+O)/2)-L)<(H-L)*0.60 AND
ABS(C-O)<(H-L)*0.60
*Sort in descending order*
Doji Star
ABS(C1-O1)>(H1-L1)*0.50 AND
O>C1 AND
ABS(C-O)<(H-L)*0.05 AND
(H-L)<(AVGH21-AVGL21)*0.20
*Sort in descending order*
Dragonfly Doji/Hanging Man
(((C<=O)*O)+ ((C>O)*C))>(H*0.95) AND
((((C<=O)*C)+ ((C>O)*O)) – L) > (H-L)*0.75
*Sort in descending order*
Engulfing
C1>O1 AND
C1
*Sort in descending order*
Evening Doji Star
ABS(C2-O2)>(H-L)*0.50 AND
C2>O2 AND
ABS(C1-O1)<(H1-L1)*0.05 AND
(H1-L1)<(AVGH21.1-AVGL21.1)*0.20 AND
O1>C2 AND
C
*Sort in descending order*
Falling Three Methods
ABS(C4-O4)>(H4-L4)*0.50 AND
C4
H3<=H4 AND
L2>=L4 AND
H2<=H4 AND
L1>=L4 AND
H1<=H4 AND
H2>H3 AND
H1>H2 AND
C
*Sort in descending order*
Grave Stone Doji/Shooting Star
ABS(C-O)<(H-L)*0.33 AND
O>C1 AND ((C+O)/2)-L<(H-L)*0.4 AND H=MAXH10
*Sort in descending order*
Hanging Man
(((C<=O)*C)+ ((C>O)*O))-L)>=ABS(C-O)*2 AND
(((C+O)/2)-L)> (H-((C+O)/2))*2 AND
ABS(C-O)>.01
*Sort in descending order*
Identical Three Crows
C2
O1=C2
*Sort in descending order*
In Neck
ABS(C1-O1)>(H1-L1)*0.50 AND
C1
(C/C1)<1.05
*Sort in ascending order*
Meeting Lines
C1
O1
CC>C1*0.99
*Sort in ascending order*
Three Black Crows
O1
O
C1
*Sort in descending order*
Three Inside Down
ABS(C2-O2)>(H1-L1)*0.50 AND
C2>O2 AND
C1
C
*Sort in descending order*
Three Line Strike
C2>C3 AND
C1>C2 AND
(H3-L3)> (AVGH21.3-AVGL21.3) AND
(H2-L2)> (AVGH21.2-AVGL21.2) AND
(H1-L1)> (AVGH21.1-AVGL21.1) AND
O>O3 AND
C
*Sort in descending order*
Three Outside Down
C2>O2 AND
C2
C
*Sort in descending order*
Tweezer Top
H=H1 AND
ABS(C-O)ABS(C1-O1)>=(H1-L1)*0.90 AND
(H1-L1)>=(AVGH20-AVHL20)*1.3
*Sort in descending order*
Upside Gap Two Crows
ABS(C2-O2)>(H2-L2)*0.50 AND
C2>O2 AND
L1>H2 AND
C1
C
*Sort in descending order*
Make Money Investing in Stock Utilizing Candlestick Signals
How do most people attempt to make money investing in stock? Buying a recommendation from somebody else and “hoping” that they make money. Unfortunately, to make money investing in stock requires a much more systematic program. Candlestick analysis provides that format. Japanese Rice traders, over the past few centuries, learned to identify patterns on charts that revealed a high probability of a reversal occurring. To make money investing in stock, an investor requires a trading plan that has validity.
Most investors try to make money investing in stock by using whatever popular investment program seems to be working at the time. The downfall of this approach is that when a program or trading method does not work, instead of trying to understand why, most investors move on to find the next trading program that seems to be working.
Utilizing candlestick signals, while trying to make money investing in stock is one important common sense aspect. Investor psychology is built into the candlestick signals. Understanding the investor psychology allows an investor to fine-tune a high probability trading method. Being that candlestick signals is the oldest and most proven trading method in the world, the assumption can be that it works. If it doesn’t seem to be working for you, then going back and analyzing what was wrong with your interpretation leads to better education of the trading program. This constant education builds knowledge that can be utilized for any trading market in the future.
Where do candlestick signals work most effectively? Candlestick signals work effectively on their own. However, the more confirming indicators an investor can apply to the analysis of a trend, the higher the probability of being in a correct trade. A candlestick buy signal, in an oversold condition, indicates a high probability that an uptrend is going to start. A candlestick buy signal in an oversold condition and forming at a major support level such as a moving average or a trend line gives that signal that much more credibility. Conversely, a candlestick sell signal in overbought condition forming right at a major moving average is a strong indication that a downtrend is going to occur. This is not rocket science! This is having the ability to analyze, through candlestick signals, what investor sentiment is doing at important support or resistance levels.
As illustrated in the Lear Corp. chart, Doji’s forming at the 200 day moving average reveal that the uptrend is becoming indecisive at a major resistance level. If a trend fails a major resistance area such as a moving average, what becomes the next target? The next moving average below. Notice that a short position established as weakness appeared just below the 200 day moving average has already produced a relatively good profit. However, analyzing the stochastics and not seeing any candlestick buy signals should create the evaluation of the downtrend still in place, the 50 day moving average being a logical target.
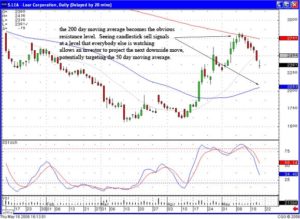
LEA
The same scenario is illustrated in the SIFY chart. The Doji shows indecision at the 50 day moving average. When a moving average is failed, two levels became the obvious targets. The recent low at approximately the $11 area was the first target. If that level was breached, 200 day moving average becomes the next target. This is a common chart pattern.
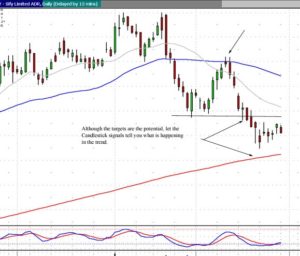
SIFY
This pattern is named the Blue Ice Failure by David Elliott of WallStreetteachers.com.
Paper Trading Futures – Getting Your Thoughts Down on Paper
![]()
Don’t you love just throwing away money? Oh, not one of your favorite things? Well, most people feel the same way so jumping into something like futures trading is pretty scary. The good news is that you can learn by throwing away some virtual money and not the real stuff with something called paper trading futures. Thanks to the wonderful world of the Internet, paper trading futures is an easy, free way to simulate futures trading without the financial risk. Before we go deeper into paper trading futures, let’s talk about futures trading in general.
Futures trading is different from investing in the stock market or bonds since you don’t actually own anything; in futures trading, you are speculating on the future direction of the price in the commodity you are trading. This is like a bet on future price direction. The terms “buy” and “sell” merely indicate the direction you expect future prices will take. He or she must only deposit sufficient capital with a brokerage firm to insure that he will be able to pay the losses if his trades lose money. (Notice the words “pay the losses”. When paper trading futures, you can ignore those nasty words!)
Futures trading is a sort of insurance plan for those who are trading and investing. A farmer may sell futures on his wheat crop if he thinks the price will go down before the harvest; conversely, a bread manufacturer may buy futures if they think the price of wheat is going to rise before the harvest. Regardless of the price movement, both are guaranteed their price. The final component of the equation is the investor in futures trading who looks for changes in the futures markets and seeks to gain advantages by buying or selling at a profit.
The Potential of Futures Trading
Trading futures is an excellent way to make money. It is said that Richard Dennis, a famed commodities trader, was able to parlay $1,600 of borrowed money into $200 million over ten years. Futures trading has a bad reputation as being filled with risk and while there is risk; the truth is that futures trading is only as risky as a trader makes it. This is not the lottery or a trip to the casino; if you take a conservative approach, look for a reasonable return and make this a business then the probability of success in commodity trading is very good. The downside of paper trading futures is that even if you amass a $200 million fortune, you can’t collect it. Remember we’re just learning while paper trading futures…you can spend real money when you open a commodities account!
Getting Started Paper Trading Futures
There are a large number of companies on the Internet that offer free paper trading; a simple Google search will give you more choices that you can imagine. These companies offer this service in hopes that after you get comfortable paper trading futures, you will open a commodity account with them. In the meantime, once you have registered simply follow the directions of the commodity trading software and you are ready to begin.
What You Might Notice
If you put the cart before the horse and try to implement positions before you understand futures trading, you will be in for a surprise. The language of futures trading is different; there is terminology you need to learn, strategies that you won’t understand and even the trading software will probably be confusing. So before you try to begin commodities trading, go back to school and learn the terms, learn the techniques and learn the software where you are paper trading futures.
Is Paper Trading Futures Important?
In and of itself, paper trading futures is not important; it is merely a simulation of the things required to trade futures in the real world. What is important while paper trading futures is the approach you take; if you treat this like a game or don’t understand the importance of learning futures trading, you should seriously reconsider attempting to trade futures. This is a skill and the consequence is losing your money so don’t take paper trading futures lightly.
Conclusion
It is difficult to find another business opportunity where you can practice and learn for free. Take advantage of this unique opportunity and start paper trading futures today.
![]()
Futures Trading for Beginners – Getting Started
![]()
They say a journey of a thousand miles begins with the first step. This is true of futures trading for beginners as well. Even if you have investment experience you might not know the difference between stock trading and futures. Don’t get worried because that is the reason for this discussion. What is going to happen is that we will look at futures trading for beginners and give you some of the basics to get you started. If you have never been exposed to futures trading, it’s OK; the journey may be a thousand miles but we will take the first step together.
What Are Futures?
Futures trading is different from investing in the stock market or bonds since you don’t actually own anything. In futures trading, you are speculating on the future direction of the price in the commodity you are trading. This is different for beginners in futures trading; it is like a bet on the future price direction. The terms “buy” and “sell” merely indicate the direction you expect future prices will take. He or she must only deposit sufficient capital with a brokerage firm to insure that he will be able to pay the losses if his trades lose money.
Futures trading is a sort of insurance plan for those who are trading and investing. A farmer may sell futures on his wheat crop if he thinks the price will go down before the harvest; conversely, a bread manufacturer may buy futures if they think the price of wheat is going to rise before the harvest. Regardless of the price movement, both are guaranteed their price. The final component of the equation is the investor in futures trading who looks for changes in the futures markets and seeks to gain advantages by buying or selling at a profit.
What Is The Potential of Futures Trading?
Trading futures has the potential to be an incredible profit maker. It is said that Richard Dennis, a famed commodities trader, was able to parlay $1,600 of borrowed money into $200 million over ten years. While his results are truly extraordinary, not everyone can expect the level of successful trading he achieved, there is good news for every investor; you can make money in futures trading. You may only be a beginner trading futures, but you are savvy enough to recognize the potential in futures trading.
What Are Futures Markets?
The beginner in futures trading needs to understand that futures are not trading on the stock market. Some of the locations are well known like the Chicago Board of Trade, the New York Mercantile, the New York Cotton Exchange and the Chicago Mercantile Exchange. Some of the better known futures markets are:
- Agriculture – This is a broad, commonly traded futures which includes such things as wheat, soybean and corn futures.
- Currency Trading – Currency trading, also known as FOREX (foreign exchange) trading, involves buying and selling currency from many different countries such as the US dollar, the British pound and the Japanese yen.
- Interest Rate Futures – This market focuses on financial transactions, interest rates and bonds.
- Energy Futures – This market centers its attention on gas and oil futures.
- Foods – This sector includes items such as coffee, sugar and orange juice.
- Metals – This is one of the more popular and better known sectors. The typical commodities in metals are gold and silver.
What Do You Need To Do To Get Started?
There are several things you need to do as a beginner in futures trading:
- Start Learning – There is no substitute for education. Read books about futures trading, talk with others that trade futures and search the Internet for information about futures trading. Once you start investing your own money, you will be glad to understand futures trading.
- Create a Commodities Trading Plan – This is crucial. You need to outline your goals and objectives as well as your strategies in an unemotional manner. This way, when greed and fear interferes with your decision making process, you will have already decided your course of action.
- Select a Broker – This is a personal, but important part of the process. You can implement your own trades but you need someone to actually place the orders. Some full-service brokers offer more services and most Internet brokers offer lower commissions. Even though you’re a beginner in futures trading, define what you want from your broker and find someone who meets your needs.
- Use Japanese Candlesticks – This powerful commodity trading and charting system will help not only the beginner in futures trading but is valuable to the “expert” as well. Candlesticks will help you to find the trends in the market that most others miss.
Conclusion
Futures trading for beginners is nothing more than learning, defining your processes and sticking to your trading plan. This journey is no longer a thousand miles for you; you’ve already taken the first step so keep moving toward you goal!
Right-click on the link below and save target to your desktop, or to a file onto your computer. Once on your own computer, the recording may be opened with Windows Media Player, or QuickTime Player.
Stock Chat – Thursday 07/27/2011
Special presentation by Stephen Bigalow on Introduction to Trading Commodities
includes limited time offer on discounted Commodity Training Tutorials.
![]()
Candlestick Charts Provide Profitable Swing Trades
Learn CANDLESTICK TRADING with Stephen Bigalow via online webinar training sessions the perfect technical analysis tool for swing trading.
Swing Trading, a relatively popular trading technique. The advent of computers over the past seven to ten years has opened the opportunity for investors to trade stocks and other investments from their home or office. The vast improvement in charting services on the Internet now provides a method for individuals to take advantage of the quick fluctuations in stock prices. Swing trading provides investors a huge opportunity to make profits. As the market sentiments evolve, long term investing becomes less of a dominant form of investing. Swing trading has many advantages over long term investing, especially when implementing with a timing technique such as candlestick trading. Swing Traders will typically hold a particular stock for anywhere from a few days to a few weeks but trade on the basis of the stock’s intra-week or intra-month price changes.
Candlestick analysis has “common sense” built into its signals. Understanding the investor sentiment prepares the candlestick investor to maximize profits in short term swing trading. To get into a trade at the optimal point, anticipating when a trend is about to reverse, is crucial. Understanding how the common investor thinks and reacts permits fast profits to be made by swing trading.
When most trends reverse, they do so with vigor. The initial day or two of a trend reversal can produce magnificent profits. Swing trading is centered upon taking advantage of that initial move. If the trader has the tools to find and exploit these moves, swing trading becomes a profitable and comfortable form of extracting profits from the market. Our contention is that the candlestick signals ARE the tools needed.
Swing trading requires the alignment and concentration of events to maximize profits. Long-term investing does not require the stringent perusal of profit parameters. How often have you heard somebody rationalize about a setback in their position, “Oh well, I’m in it for the long term.” This statement is often uttered instead of taking a progressive stance towards one’s investment goals.
Swing trading represents the exact opposite. An investor trying to maximize profits from a two to ten day holding period has to have analyzed all elements. When swing trading, the establishment of a trade has to be exacting in its purpose, making a profit NOW in that trade.
The innate characteristics built into candlestick signals produce the parameters that make swing trading successful. The recognition of pattern reversal in a trend can be visually depicted in the signals. For the aggressive swing trader, knowing how the signals are formed can produce trades that pinpoint the exact point in which to enter a trade. Additionally, the same indications that get the candlestick swing trader into a trade will alert the trader when it is time to get out.
As seen in the following chart, notice the Doji signals at each turn. Knowing what to do after each signal creates the format for profitable swing trading. Knowing the simple rules about what to do once observing a Doji has the candlestick swing trader in and out of trades at the optimal points.
Swing Trading, Doji
Learning the methods to evaluate the signals makes swing trading an easy program to extract profits out of the market consistently. Candlestick signals provide two valuable facets. First, the signal searches locate the high potential profitable swing trades. The searches can be constructed to find the signals that occur at the best positions during a trend movement. Finding a candlestick buy signal when stochastics are oversold or searching for a gap up after a Doji are a couple of examples on how to fully utilize the search capabilities. The second facet is the pinpointing when to get into and out of a trade as explained earlier.
Swing trading concentrates on the alignment of parameters to maximize profits. The candlestick signals add the dimension of allowing successful trades to run, as well as showing when a trade has fizzled. The Candlestick Trading Forum specializes in identifying trades suitable for the swing trading investment community. Please review the services provided on the website. Swing trading lies at the core of Mr. Bigalow’s assertion that the candlestick signals can be traded to produce 10% per month return from the stock market. Join the community of traders that search, research and make available swing trading ideas on our Forum and Stock Chat Room.
Trading Tactics
Trading tactics can make the difference between success and failure in trading stocks, commodities and Forex. Whether you are trading directly or trading options or futures, good trading tactics can increase your profit and bad trading tactics can lead to substantial losses. Simple and effective trading tactics include always setting your trading stops when you are trading online. Likewise for short term trading and short term investing using trading limits is wise. Always work to understand the basic fundamentals of each stock or commodity in which you invest or trade. Much of fundamental analysis gets incorporated into stock price and commodity price as soon as it is known so we might think fundamentals are not important. However, knowing the fundamentals of a stock gives us a clear idea of the limits of stock price for it is, in the end, the fundamentals that govern stock prices. Always, always, always follow price patterns with technical analysis tools such as Candlestick pattern formations.
Because Candlestick analysis signals are clear and easy to read they tend to reduce the possibility of misunderstanding. This is, unfortunately, too often the case with how technical analysis results are displayed. The results and predictions with other technical analysis tools may well be the same as those of Candlestick analysis. However, Candlestick analysis distills all of the information into easy to read Candlestick signals allowing traders to proceed to the business of stock trading or commodity trading while others are still puzzling over just what their online trading software is trying to tell them.
General trading tactics include buying on the rumor and selling on the news. A more accurate description of how this works is that the trader sees an emerging pattern in his Candlestick stock charts. He may have been alerted to this stock by reading the stock market news. But, it is by careful examination of stock prices and their patterns that the trader using Candlesticks sets up his trade. He will buy stock, sell stock, sell short, or buy or execute options contracts when the time is right according to Candlestick chart analysis. He will then check the stock market news to confirm that a piece of news has hit the streets causing everyone else to enter the trade, often too late for good profits.
When you are in a losing position, don’t keeping adding money to the trade. This is better put in a very old saying, “Don’t throw good money after bad.” This is a matter of discipline. Trading is not gambling. We use solid tools such as Candlestick patterns in order to guide our investing and trading decisions. Letting the psychology of trading take over in a moment of difficulty is letting the twin demons of greed and fear run the show. They virtually never make you a profit and can often leave you bankrupt! The best of trading tactics is to follow your Candlestick signals, trust them, and act on them.
In regard to acting on Candlestick chart analysis there are times when not to trade. The beauty of Candlestick signals is in their clarity. Trying to force trades is one of the bad trading tactics that deplete your margin account. Sometimes the best of trading tactics is not to trade at all. Satchel Page, the famous 20th century baseball pitcher once said that if he just held on to the ball the batter could not hit it. Likewise, not forcing bad trades keeps the market demons away and saves you money. Use your Candlesticks, trust them, and when they say not to trade, don’t!
Market Direction
Was there a way to take advantage of the big gap-down selling today? Not really! The nature of the market trading for the past few weeks has been very schizophrenic, up big one day and down big two days later. Both the Dow and the NASDAQ opened to the downside very quickly today. Most stocks gapped down, not giving the opportunity to short them. Was candlestick analysis a benefit to investors in predicting a gap down? No, but candlestick analysis should have had the portfolio positioned correctly.
For the past two weeks, the wild fluctuations in the markets have revealed the Bulls and the Bears did not have control of the market direction. When there is no evidence of a viable trend, this has obvious consequences for an investor. The major benefit of candlestick analysis is that it allows an investor to evaluate a direction of a price/trend with reasonably accurate results. The purpose of investing is to put funds to work with the probabilities being in your favor. When the market conditions demonstrate there is no beneficial probabilities, the investor has investment decisions that can be made from that information.
DOW
NASDAQ
As the Dow chart and the NASDAQ chart reveals, a sideways trend channel had been in progress for the past two or three weeks. These conditions did not produce any favorable probabilities for either to be long or short. In most cases, the proper investment strategy would have been to sit on the sidelines until a trend direction could be detected. This is the logical strategy for the majority of traders. However, candlestick analysis provides one more opportunity. It allows an investor to pinpoint the few stocks that are showing good strength and the few stocks that are showing great weakness. This allows for a portfolio mixed with long and short positions that will benefit from the sideways market.
There will always be opportunities to make money in all market conditions. The simplicity of candlestick scans allows for identifying the positions that are moving, even with the market in a relatively flat mode. Take advantage of the information built into the signals and patterns. This information will allow for highly accurate trend of valuation and the ability to make profits when others are sitting on the sidelines. Candlestick analysis provides a trading platform consisting of reoccurring price movements based upon investor sentiment.
Understanding the psychology that is built into the signals is a major factor for understanding why prices move as they do. Recognizing pattern setups allows an investor to take advantage of big price moves prior to their movement. As illustrated in the TCK chart, the slow curve showing failure at the T-line was an indication the bears were starting to take control. These are trading areas that can be executed prior to a major move to the downside. The inherent pressures of price movements makes it feasible to take advantage of prices going in the direction of the market indexes while also being positioned in trades that were anticipating the opposite direction. Those trades, although producing small losses when the market moves big in one direction, would be much more than offset by the positions that were oriented toward the actual market move.
TCK
EW
Chat session tonight at 8 PM ET.
The new book – Candlestick Profits, Eliminating Emotions with Candlestick Analysis, is in delivery from the printers. They should be in Houston on Tuesday, March 15. If you have not yet ordered your book, please do so this week. Once the books are sent out, you will have lost the opportunity of finding that crisp $100 Bill to be placed in one of the premarket release books. Hurry to order the new book Candlestick Profits – Eliminating Emotions with Candlestick Analysis before the special end!
Good Investing,
The Candlestick Forum Team