A commodity trading system can be constructed in an afternoon or it can take months. Depending upon how complex a commodity trading system is commodities traders will be able to keep track of the necessary figures on a notepad or may need to feed data in a computer program. The basis of a system for trading commodities is using available data from commodities markets to predict the markets’ next moves. Although you can buy a prepackaged trading system, the exercise of constructing a basic commodity trading system is a useful exercise for beginner or pro. A system based upon Candlestick charting will help beginning traders and experienced traders see the market more clearly. This sort of exercise coupled with a Commodity and Futures training course will get you off to a good start trading commodities.
The exercise of setting up a basic commodity trading system forces a number of basic and important decisions. How much will you invest in a commodity market? How long will your trades last from buy to sell or sell to buy? How much will you invest per trade? What will your stop loss be? Just which commodities will you trade? Commodity trading charts such as used to view Candlestick chart formations are basic to understanding the trends and reversals of the commodities market. Support and resistance zones become clear with Candlestick charting. As a new trader engages in Commodity and Futures training the simple exercise of setting up a basic commodity trading system will help you convert training principles to good trading habits.
Deciding how much you will trade will determine the size of your margin account which will be your minimal trading capital. Likewise deciding upon which market to trade will determine minimum lot sizes and necessary trading capital. Aluminum and copper both trade in 25 metric ton lots and soybeans trade in 5,000 bushel lots. As an example, daily trading limits on soybean trading on COMEX are $0.70 per bushel expandable to $1.05 and then $1.60 at market close with limit bids and offers. A daily limit of $1.05 on 5,000 bushels comes to $5,250. This gives an idea of the kind of calculations that need to go into a commodity trading system just for trading futures in soybeans. Whatever commodity you are trading you will need to consult the commodities exchange trading rules when setting up your trading system.
A commonly used charting tool to incorporate in a commodity trading system is a twenty day moving average. In moving average trading the trader can use market highs, lows, openings, or closings for the last twenty days. At the end of the trading day the appropriate number is added to the twenty day list and the oldest day is removed. The trader takes the sum of the twenty numbers and divides by twenty. This is the average of the last twenty days. This is noted on a chart along with the high, low, open and close for the day. This average over time is the twenty day moving average. The moving average presents a smoother curve of market prices. This helps in trend trading to see where the market is really heading.
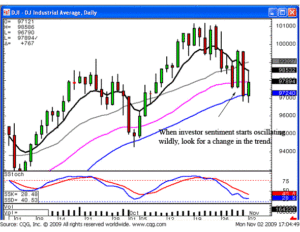
Market Direction
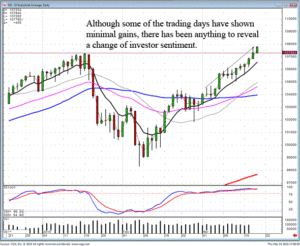
Let the market tell you what the market is doing! That is the mantra of candlestick analysis. The Japanese Rice traders professed this philosophy and made fortunes in the rice market. What is the stock market telling us today? It is still in a slow steady uptrend. How does this information help the candlestick investor? Most investors have a portfolio that would be coming up modestly during a slow uptrending market. The candlestick investor has a completely different perspective. A slow uptrending market reveals one important aspect. Investor sentiment is not changing. This is very informational for a candlestick investor. Having the scanning capabilities and the visual analysis capabilities to identify signals and patterns that produce inordinately strong profits, creates the opportunity to take advantage of those signals and patterns. As long as the market is not experiencing a dramatic change of investor sentiment, price patterns have a greater potential of fulfilling strong price moves.
The profit results from a Fry pan bottom breakout or a confirming J-hook pattern is many times greater than the normal uptrending stock price. Candlestick patterns are created by the accumulative knowledge of everybody buying and selling during a particular time frame. Reoccurring thought processes can be visually witnessed as a price pattern develops. The creation of that pattern is usually based upon elements other than the general market movement. That is why patterns usually produce good profits in spite of the general direction of the market. The operative word is ‘usually’! The probabilities improve dramatically for the profitable results of a pattern if the general market has not had a severe change of investor sentiment. A bullish pattern obviously is going to work much better in a bullish environment. Although a pattern still has a good chance of working well even when the market may change direction severely, the overall probabilities start to diminish. A severe selloff in the market will be part of that accumulative knowledge of the buyers and sellers. This is why a very slow uptrending market can still be extremely profitable for a candlestick investor. The general market conditions do not become a factor for a pattern price move.
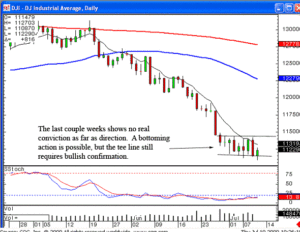
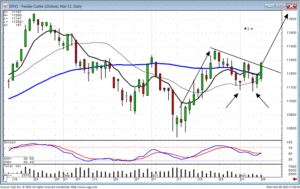
DOW
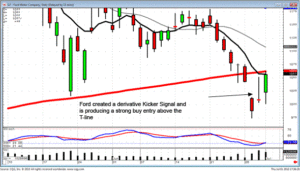
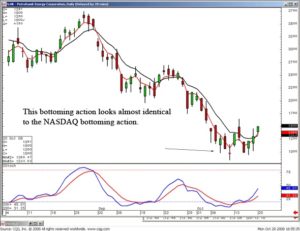
F
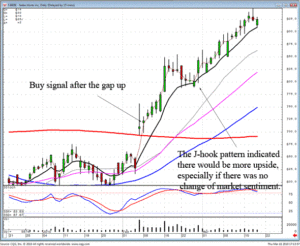
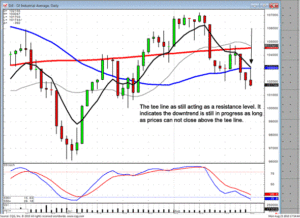
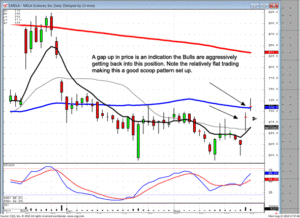
BeBe
Commodity trades have an advantage over stocks. They do not have as many outside influences dictating the direction of their price move. The price of soybeans or copper are more oriented towards supply and demand factors than all the other elements that are affecting stock prices. This makes the price trend of a commodity price much easier to analyze. A commodity stock chart can be analyzed much more on a pure technical basis. A price pattern is much more effective when analyzing the potential pattern it may be forming. Our recent recommendation, shorting lean hogs, was reversed once the signals indicated a potential of a J-hook pattern.
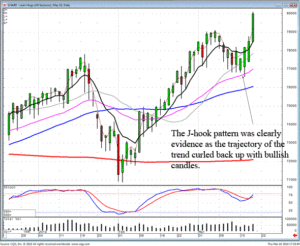
May Lean Hogs
What does this knowledge to for a commodity trader? Because of the speed and leverage involved in commodity prices, a trader needs to be knowledgeable in anticipating what a price might do. As can be seen in the Lean Hog May contract, it became apparent the Bulls were continuing to participate after a short pullback. The potential of a strong downward move could be seen to be diminishing. This makes for a prepared decision-making process. Once it became apparent the Bulls were still participating, the quick execution for closing the short positions and establishing new long positions could be done on a mechanical basis. Emotions would not have anything to do with reversing the trade.
The Candlestick Forum has just made the Candlestick Forum Commodity Trading videos available. If you would like to sharpen your analytical skills, take advantage of the knowledge that has been incorporated into these training videos. Commodity trading requires much faster trade analysis and execution. The insights conveyed in these training CDs not only will greatly improve your commodity trading talents, but they will also hone your abilities to trade stocks much better. The information built into the analysis of commodity and currency price movements allows an investor’s mind to anticipate the next move. This produces decision-making thought processes that result in faster and more confident trade positioning.
Chat session tonight at 8 PM ET – Everybody is welcome. Learn how to identify commodity and stock pattern breakout setups.
Good Investing,
The Candlestick Forum Team
Website special reflects current newsletter. If you are reading an archived newsletter you will be directed to the Current Website Special.