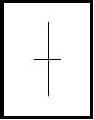
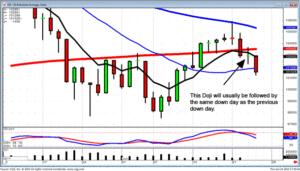
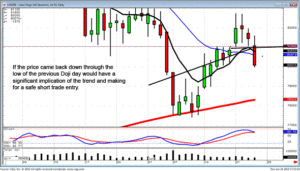
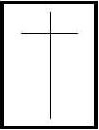
How To Trade The Stock Market Using The Major Candlestick Signals

The Major Signals

Doji

Doji

DOJI Recognition: The open and close are the same or very close to the same.

Pattern Psychology: The Bulls and the Bears are conflicting. This is an alert to investors to take heed for possible trend reversal.

Related Articles: How To Trade the Doji SignalThe Dynamic Doji

Training Tutorial: Dynamic Doji

View Current Charts & Lists of Stocks for  Doji Stock Screens
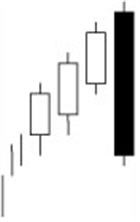
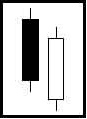
 

Bullish Engulfing Pattern

Bullish Engulfing

BULLISH ENGULFING Recognition: The body of the second day completely engulfs the body of the first day. Shadows are not a consideration.

Pattern Psychology: This pattern suggests the Bulls are stepping in with force, suggesting prices will move up.

Related Articles: How to Trade the Bullish Engulfing SignalCandlestick Engulfing Patterns

Training Tutorial: Bullish Engulfing

View Current Charts & Lists of Stocks for Bullish Engulfing Stock Screens
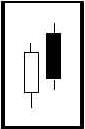
Bearish Engulfing Pattern

Bearish Engulfing

BEARISH ENGULFING Recognition: The body of the second day completely engulfs the body of the first day. Shadows are not a consideration.

Pattern Psychology: This shows the Bears are overwhelming the Bulls, suggesting prices will move down.

Related Articles: How to Trade the Bearish Engulfing SignalCandlestick Engulfing Patterns

Training Tutorial: Bearish Engulfing

Hammer Hanging Man

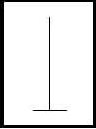
Hammers and Hanging Man

HAMMERS and HANGING-MAN

Recognition: The lower shadow (or tail) should be at least two times the length of the body. The color of the body is not important although a black body has slightly more Bearish indications and a white body has slightly more Bullish indications.

Pattern Psychology: This pattern at the bottom of a down trend is called a Hammer. This pattern at the top of an uptrend is called a Hanging-Man

Related Articles: How to Trade The Hammer Signal, How to Trade the Hanging Man

Training Tutorials: HammerInverted HammerHanging Man

Piercing Pattern

Piercing Pattern

PIERCING PATTERN Recognition: A two candle pattern, the body of the first candle is black and the body of the second candle is white. The white day opens lower, under the trading range of the previous day. The price closes above the 50% level of the black body.

Pattern Psychology: After a strong downtrend, the atmosphere is Bearish but before the end of the day the Bulls step in and price closes near the high of the day.

Related Articles: How to Trade the Piercing Pattern

Training Tutorial: Piercing Pattern
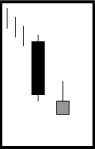
Dark Cloud

Dark Cloud

DARK CLOUD Recognition: A two candle pattern, the body of the first candle is white and the body of the second candle is black. The black day opens higher, above the trading range of the previous day. The price closes below the 50% level of the white body.

Pattern Psychology: After a strong uptrend, the atmosphere is Bullish but before the end of the day the Bears step in and price closes near the low of the day.

Related Articles: Stock Trading Methods, How to Trade the Dark Cloud Signal

Training Tutorial: Dark Cloud Cover
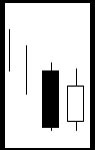
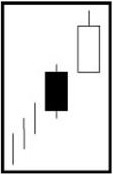
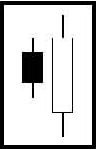
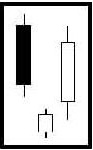
Bullish Harami

Bullish Harami

BULLISH HARAMI Recognition: A two candle pattern forming in a down trending price pattern. The body of the first candle is the same color as the current trend and should be a long black candle. The body of the second candle is white and opens and closes within the body of previous day’s candle.

Pattern Psychology: After a strong downtrend the Bulls step in and open the price higher than the previous day’s close. This concerns the Bears and the shorts start covering their positions. A strong day after that would convince everybody that the trend may be in a reversal.

Related Articles: How to Trade the Bullish Harami, The Harami – A High Profit Candlestick Signal

Training Tutorial –  Harami Pattern
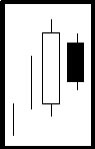
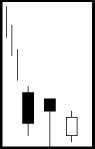
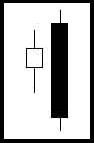
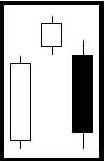
Bearish Harami

Bearish Harami

BEARISH HARAMI Recognition: A two candle pattern forming in an up trending price pattern. The body of the first candle is the same color as the current trend and should be a long white candle. The body of the second candle is black and opens and closes within the body of the previous day’s candle.

Pattern Psychology: After a strong uptrend the Bears step in and open the price lower than the previous day’s close. The price finishes lower for the day and the Bulls are concerned and begin taking their profits.

Related Articles: How to Trade The Bearish Harami The Harami – A High Profit Candlestick Signal

Training Tutorial: Harami Pattern
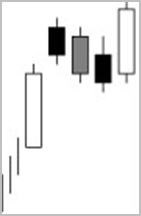
Morning Star

Morning Star

MORNING STAR Recognition: A three candle pattern at the bottom of a downtrend.The body of the first candle is black, confirming the current downtrend. The second candle is an indecisive formation. The third candle is white and should close at least halfway up the black candle.

Pattern Psychology: After an apparent downtrend the Bulls step in and open the price higher than the previous day’s close. The price finishes higher for the day and the Bears are concerned and begin covering their short positions.

Related Articles: How to Trade the Morning Star Signal, Morning Star Reversal Signal

Training Tutorial: Morning Star & Evening Star Signals

Evening Star

Evening Star

EVENING STAR Recognition: A three candle pattern at the top of an uptrend. The body of the first candle is white, confirming the current uptrend. The second candle is an indecisive formation. The third candle is black and should close at least halfway down the white candle.

Pattern Psychology: After an apparent uptrend the Bears step in and open the price lower than the previous day’s open. The price finishes lower for the day and the Bulls are concerned and begin selling to take their profits.

Related Articles: How to Trade the Evening Star Signal    Swing Trading with an Evening Star Signal

Training Tutorial: Morning Star & Evening Star Signals

Kicker Signals Bearish and Bullish

Kicker Signals

Kicker Signals Bearish and Bullish Recognition: The first day’s open and the second day’s open are the same BUT the price movement is in opposite directions.

Pattern Psychology: The Kicker Signal demonstrates a dramatic change in investor sentiment. The longer the candles, the more dramatic the price reversal.

Related Articles: What is the Strongest Candlestick Signal – The Kicker!, Technical Analysis that Produces Big Profits

Training Tutorial: Kicker Signals
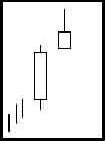
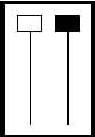
Shooting Star

Shooting Star

SHOOTING STAR Recognition: One candle pattern appearing in an uptrend. The shadow (or tail) should be at least two times the length of the body. The color of the body is not important, although a black body has slightly more Bearish indications.

Pattern Psychology: After a strong uptrend the Bulls appear to still be in control with price opening higher, but by the end of the day the Bears step in and take the price back down to the lower end of the trading range. Lower trading the next day reinforces the probability of a pullback.

Related Articles: How to Trade the Shooting Star Signal

Training Tutorial: The Shooting Star

Inverted Hammer

Inverted Hammer

INVERTED HAMMER Recognition: The upper shadow should be at least two times the length of the body. The real body is at the lower end of the trading range. There should be no lower shadow or a very small lower shadow.

Pattern Psychology: After a downtrend has been in effect, the atmosphere is Bearish. The price opens and trades lower but before the end of the day, The Bulls step in and take the price back up. A higher open or a white candle the next day reinforces buying.

Related Articles: Technical Analysis SimplifiedHow to Trade the Inverted Hammer

Training Tutorial: The Inverted Hammer

The Separating Lines Candlestick Pattern

SEPARATING LINES
(iki chigai sen)

Separating Lines

Description

Iki chigai sen is defined as ‘lines that move in opposite directions.’ The market is in an uptrend when there is a pullback, exhibited by a long black candle. However, the next day opens back up at the same level as it open the prior day. The Separating Lines Candlestick Pattern has the same open and is the opposite color. This is the exact reverse of the Meeting Line Pattern. In other Japanese circles, this is also known as Furiwake or Dividing Lines.

Criteria

  1. An uptrend is in progress.Then a day occurs that is the opposite color of the current trend.
  2. The second day opens at the open of the previous day.
  3. The second day, should open on its low for the day and proceed to go higher

Pattern Psychology

During the uptrend, a black body occurs. This causes some concern to the Bulls. But the next day the prices gap back up to the previous day’s open. This gives the bulls confidence that the trend still has life in it. They jump back in and move prices higher. Confidence is renewed and the trend continues. The bearish Separating Line works the exact same way in the opposite direction.

Back to Continuation Patterns

Commodity Value

What is the value of a commodity? Commodity value is the price that the commodity will fetch in the commodities markets. This market value can be predicted by use of time honored technical analysis tools such as Candlestick charting and Candlestick trading tactics. The factors that determine what the market considers to be commodity value come from fundamental analysis of commodities. A good place to learn about commodity value and about successful commodity trading is with Commodity and Futures TrainingTraders buy and sell futures in commodities using Candlestick basics to help predict what the market will think a commodity will be worth in coming weeks, months, and years.

The official economic description of commodity value is its free market intrinsic value under optimal use conditions.h In buying and selling corn futures or in live cattle commodity trading the market will assume that the farmer or rancher will put his resources to best use.h In regular terms this means that in a free market the producer will do his or her best to produce a product most efficiently and economically. He or she will expect to receive more or less for his or her product based upon market demand, product availability, and product quality. In a free market traders will buy and sell futures contracts on oil futures, gold futures, interest rate futures and the like with the expectation that supply and demand will determine the spot price of the commodity at contract expiration.

Commodity value is typically stated in terms of a base currency such as the US dollar. However, as anyone who engages in Forex trading knows, currencies vary in value in relation to each other and in relation to commodities. In times of high inflation the commodity value of things such as oil and gold go up in relation to the Dollar, Euro, or Pound Sterling as traders come to expect that holding commodities will be a more secure means of protecting wealth than holding fiat currencies. Hedging by producers and buyers of commodities is the basis of the commodity market. By selling futures the producer will guarantee an income at a given commodity price at a future date. Buyers will likewise obtain a price guarantee of part, or all, of the commodity they will need in coming months or years. Airlines, railroads, and shipping lines commonly buy futures to protect themselves from the effects of inflation on the cost of fuel.

Because commodities have an intrinsic value based upon supply and demand they are most efficiently traded in free markets. When countries such as Venezuela try to control the value of their currency and commodities, black markets develop. These black markets are actually free markets which are only illegal because the country or jurisdiction in question attempts to artificially control commodity value and currency value. In Poland before the fall of Communist Eastern Europe there were continual food shortages as the government attempted to control food production and prices. However, cut flowers were plentiful and cheap. The government did not control production and the basic commodity value is what people paid for flowers.In trading commodities it is wise to remember that very basic factors will decide what a commodity will sell for on contract expiration date. This places reasonable limits on commodities trading which the wise trader will heed.

Market Direction

There are very simple price patterns that develop using candlestick signals. The simple rules applied to Doji’s make for easy trade entries and very profitable day-trades. The long-legged Doji of Monday was a clear indication the uptrend had failed at the 50 day moving average. It became more evident as the Dow sold off on Tuesday. Wednesday indicated indecisiveness in the form of a Doji day. However, this Doji becomes very informative. The downtrend had started with a strong selling day. Yesterday’s Doji indicated the Bulls and the Bears were in conflict. Yesterday’s trading was close enough to the tee line to still make it a factor. Fortunately for candlestick investors, there are expectations after a Doji day like we saw yesterday. One of the simple rules of candlestick’s is the trend will move in the direction of how they open prices the next day after a Doji. Today’s pre-market futures indicated a lower open. This was an immediate alert for adding more short positions to the portfolio.

Commodity Value DOW June 24

DOW

Candlestick signals and patterns provide a set of expectations. This makes analyzing a price trend much more accurate. Had the pre-market futures showed positive trading this morning, a completely different scenario would have been put in place. The Doji, very close to the tee line, would have been indicating the tee line was going to act as a support level, had the market open positive today and traded positive. Utilizing the expected results on a day-to-day basis allows an investor to accurately assess day trades or short-term swing trades. The analysis of a price move can be evaluated with a high degree of accuracy when applying the visual characteristics of a signal in conjunction with confirming indicators.

This technique allows for low risk, high probability entry strategies. As witnessed in the entry of a short position in July Lean Hogs, a very low risk trade entry could be put in place. Note how the price had traded positive from where it opened today, creating the upward shadow. Had the price of July Lean Hogs remained positive during the day, the analysis would have been the tee line was acting as support. However, there were some indications that the Bears ‘could be’ in control.

Tuesday’s trading formed a long-legged Doji with a tweezers top. Yesterday’s trading, although somewhat indecisive, closed more than half way down the big bullish candle of Monday. This could have been evaluated as an Evening Star signal. This makes for a very low risk trade. While the price was trading positive today, putting a sell stop one tick below yesterdays low would have been a safe entry to go short.

July Lean Hogs

Commodity Value LH3

The logic being if the price stayed positive, then tomorrow would have warranted looking for the uptrend to continue.However, if the price came back down through yesterday’s low, that would have revealed some very important information. The price was now going to trade below the tee line and the stochastics trajectory would be more oriented toward rolling over. It was the accumulation of analysis of the past two or three trading days that would have made this a logical sell stop entry.

As a day-trader, having the ability to analyze what is occurring in the daily chart as well as the one minute chart and five minute chart, makes for extremely accurate trade evaluations. For the swing trader, anticipating the results of existing signals allows for an entry into a trade that should immediately produce profits. This factor is important for keeping the mental process clear. A price move that creates good profits immediately allows for safe stop loss levels to be implemented. This saves an investor from having the anguish of watching their trade get executed and then have the price hover around that level. This usually takes an investor’s time and energy to watch that trade much more closely, having to worry whether the price is going to bounce in the opposite direction. The use of simple trading techniques helps an investor make profits in a much more comfortable fashion.

The Inverted Hammer Signal

Learning how to play the stock markets an endeavor that most investors never master.  Learning how to play the stock market involves controlling one’s emotions.  Candlestick signals are a great benefit for the beginning investor as well as the experienced trader.  The information conveyed in the major candlestick signals is the visual depiction of investor sentiment.  Most investors’ sentiment unfortunately involves the extremes of human emotions, fear and greed.  Learning how to play the stock market is an educational process.  An investor should learn the basics of why prices move.  The candlestick signals, especially the 12 major signals, involve the visual elements produced by human emotions.  Being able to correctly analyze what these emotions are doing at specific points of a trend become a valuable pool for successful investing.

The information incorporated into a major candlestick signal provides a huge advantage for those investors just learning how to play the stock market.  The result of simple visual analysis permits an investor to take advantage of high probability situations.  The major signals are created by the aspects of human emotions being put into trading decisions.  Investor psychology produces reoccurring thought processes as investors go through different stresses of a price trend.  The 12 major signals are a very important tool when learning how to play the stock market.  Understanding the investment psychology that creates each signal is an important element for understanding how professional investors think. One of the most important facets for learning how to play the stock market is knowing how to put the probabilities in your favor.  The candlestick signals create a format that does just that.  Hundreds of years of observations have resulted in reversal signals that are easy to identify.  When learning how to play the stock market, it is very important to find indicators that have a high probability of producing profits and a low probability of producing losses. This may be stating the obvious.  However, the utilization of candlestick signals is being done by a very small percentage of the investment population.  Use the major signals to start profiting from your investment decisions immediately.

The Inverted Hammer  produces some very important attributes when analyzing a potential reversal.  It is considered one of the 12 major signals.  Learn how to use an inverted hammer signal correctly.

Inverted Hammer

Description

The Inverted Hammer is comprised of one candle. It is easily identified by the small body with a shadow at least two times greater than the body. Found at the bottom of a downtrend, this shows evidence that the bulls are stepping in, but the selling is still going on. The color of the small body is not important but the white body has more bullish indications than a black body. A positive day is required the following day to confirm this signal.

Criteria

1.  The upper shadow should be at least two times the length of the body.
2.  The real body is at the lower end of the trading range. The color of the body is not important, although a white body should have slightly more bullish implications.
3.  There should be no lower shadow, or a very small lower shadow.

Signal Enhancements

1. The longer the upper shadow, the higher the potential of a reversal occurring.
2.  A gap down from the previous day’s close sets up for a stronger reversal move.
3.  The day after the inverted hammer signal opens higher.
4.  Large volume on the day of the inverted hammer signal increases the chances that a blow-off day has occurred.

Pattern Psychology

After a downtrend has been in effect, the atmosphere is bearish. The price opens and starts to trade higher. The Bulls have stepped in, but they cannot maintain the strength. The existing sellers knock the price back down to the lower end of the trading range. The Bears are still in control. But the next day, the Bulls step in and take the price back up without major resistance from the Bears. If the price maintains strong after the Inverted Hammer day the signal is confirmed.

 Training Tutorials

The Major Signals Educational Package  has over 8 Hours of training for trading Candlestick Signals or The Inverted Hammer individual training video available for Quick Download.

Candlestick Forum Flash Cards  These unique Flash Cards will allow you to be “trading like the Pro’s” in no time.

Return to Candlestick Explanation of the Major Signals

Trading the Mat Hold Candlestick Pattern

Mat Hold
(uwa banare sante oshi)

Mat Hold

Description

Similar to the ‘Rising Three Method’, it has the look of an Upside Gap Two Crows except that the second black body (third day) dips into the body of the large white candle. It is followed by another small black body that dips a bit further into the white candle body. The final day gaps to the upside. It continues its upward move to close higher than the trading range of any of the previous days.

The implication is that the trend has not been stalled. This is a good point to add to positions. The Mat Hold pattern is a stronger continuation pattern than the Rising Three Method. During the days of ‘rest,’ unlike the Rising Three Method, the price stays close to the top of the white candle’s upper range.

Criteria

  1. An uptrend is in progress. A long white candle forms
  2. A gap up day that closes lower than its open creates a small black candle
  3. The next two days form small candles somewhat like the Rising Three Method.
  4. The final day gaps up and closes above the trading ranges of the previous four days.

Pattern Psychology

The Mat Hold pattern does not pull back as much as the Rising Three Method. It is easier to identify. The pull-back days are less concerning. The relatively flat rest period does not create the concern that the Rising Three Method does. After three days of the bears not being able to knock the price down to any great degree, the bulls step back in with confidence.

Back to Continuation Patterns

Trading the Three Line Strike Continuation Pattern

Three Line Strike
(sante uchi karasu no bake sen)

Three Line Strike

Description

Three Line Strike, also known as the Fooling Three Soldiers, is a four-line pattern that occurs during a defined trend. This pattern represents a resting period, but unlike most resting periods, this one occurs all in one day. It ends up as an extended Three White Solder pattern

Criteria

  1. Three White Soldiers, three white candles, are continuing an uptrend
  2. The fourth day open higher, but then pulls back to close below the open of the first white candle

Pattern Psychology

The Three White Soldiers indicate the trend is continuing. The fourth day opens in a manner that resembles the previous days; however, profit taking sets in. It continues until the close is below the open of the first white candle. The black candle body completely negates the rise of the past three days, but it has gotten the short-term pullback sentiment out of the way. The uptrend continues from this point.

Back to Continuation Patterns

Practice Stock Trading with Candlestick Chart Patterns

Practice Stock Trading –  important advice to novices to the stock market. A great way to practice stock trading is to paper trade. This simulated trading provides great insight without risking any real money while you practice stock trading. There is one caveat to paper trading; play money is very different from real money. While it is wise to practice stock trading before putting your hard-earned bucks on the line, the emotional component is not as intense.

As your finger hovers nervously over the “submit” button to place your first trade, you experience a tightening in your stomach that is oddly exhilarating and yet unsettling. It is amazing how many thoughts go through your mind once you close your eyes, push that button and start watching your trade. “Please, please let this be a good trade”  “Maybe I should practice stock trading a bit more, I think I’m going to be sick”  “Is my trade running against me already!”  “Should I get out now or wait? Maybe I should turn this trade into a long-term hold and wait for it to go back up.”  “My wife is going to kill me!”  NOW you know why we recommend trading with candlestick charts. Take advantage of the emotional component that all investors experience and see it; Visually depicted  in the charts.  Japanese Candlestick charting dramatically increases the information conveyed into visual analysis. Each candlestick trading formation clearly illustrates the change of investor sentiment. This process is not apparent in standard bar chart interpretation. Capitalize on the emotional process other investors fall prey to  and practice stock trading with candlesticks.

We recommend you begin learning the 12 Major Candlestick Signals – Major in the sense that they occur in price movements often enough to be beneficial in producing a steady supply of profitable trades. Once comfortable with the major signals, expand on your training to include the Secondary signals, which do not occur as often as the Major Signals but are just as effective.

Trading the Unique Three River Bottom Pattern.

Three River Bottom Pattern

Description

The Unique Three River Bottom is a bullish pattern, somewhat characteristic of the Morning Star Pattern. It is formed with three candles. At the end of a downtrend, a long black body is produced. The second day opens higher, drops down to new lows, then closes near the top of the trading range. This is a Hammer-type formation. The third day opens lower but not below the low of the previous day. It closes higher, producing a white candle. But it doesn’t close higher than the previous day’s close. This pattern is a rare pattern.

Criteria

  1. The  candlestick body of the first day is a long black candle, consistent with the prevailing trend.
  2. The second day does a harami/hammer. It also has a black body.
  3. The second day’s shadow has set a new low.
  4. The third day opens lower, but not below the lowest point of the previous day. It closes higher but below yesterday’s close.

Signal Enhancements

1. The longer the shadow of the second day, the probability of  a successful reversal becomes greater. 

Pattern Psychology

After a strong downtrend  trend has been in effect, the trend is further promoted by a long body black candle. The next day prices open higher but the bears are able to take prices down to new lows. Before the end of the day, the bulls bring it back up the the top end of the trading range. The third day, the bears try to take it down again, but the bulls maintain control.  If the following day sees prices going up to new highs, the trend has confirmed a reversal.

The Major Japanese Candlestick Patterns

Learn JAPANESE CANDLESTICKS with Stephen Bigalow via online webinar training sessions.

There are really only 12 major Candlestick patterns that need to be committed to memory. The Japanese Candlestick trading signals consist of approximately 40 reversal and continuation patterns. All have credible probabilities of indicating correct future direction of a price move. The following dozen signals illustrate the major signals. The definition of “major” has two functions. Major in the sense that they occur in price movements often enough to be beneficial in producing a ready supply of profitable trades as well as clearly indicating price reversals with strength enough to warrant placing trades.

Utilizing just the major Japanese Candlesticks trading signals will provide more than enough trade situations for most investors. They are the signals that investors should contribute most of their time and effort. However, this does not mean that the remaining patterns should not be considered. Those signals are extremely effective for producing profits. Reality demonstrates that some of them occur very rarely. Other formations, although they reveal high potential reversals, may not be considered as strong a signal as the major signals.

Below  is the summary of the major candlestick formations and their definitions. For free print version of signal, with pattern recognition and trading psychology – Click Here Additionally, clicking on any of the individual signals will take you to the specific trading criteria plus signal enhancements and pattern recognition for printout.

Doji is formed when the open and the close are the same or very close. The length of the shadows are not important. The Japanese interpretation is that the bulls and the bears are conflicting. The appearance of a Doji should alert the investor of major indecision.
The Gravestone Doji is formed when the open and the close occur at the  low of the day. It is found occasionally at market bottoms, but it’s forte is calling market tops. The name, Gravestone Doji, is derived by the formation of the signal looking like a gravestone.
The Long-legged Doji has one or two very long shadows. Long-legged Doji’s are often signs of market tops. If the open and the close are in the center of the session’s trading range, the signal is referred to as a Rickshaw Man. . The Japanese believe these signals to mean that the trend has “lost it’s sense of direction.”
The Bullish Engulfing Pattern is formed at the end of a downtrend. A white body is formed that opens lower and closes higher than the black candle open and close from the previous day. This complete engulfing of the previous day’s body represents overwhelming buying pressure dissipating the selling pressure.
Bearish Engulfing Pattern The Bearish Engulfing Pattern is directly opposite to the bullish pattern. It is created at the end of an up-trending market. The black real body completely engulfs the previous day’s white body. This shows that the bears are now overwhelming the bulls.
Dark Cloud The Dark Cloud Cover is a two-day bearish pattern found at the end of an upturn or at the top of a congested trading area. The first day of the pattern is a strong white real body. The second day’s price opens higher than any of the previous day’s trading range.
Piercing Pattern The Piercing Pattern is a bottom reversal. It is a two candle pattern at the end of a declining market. The first day real body is black. The second day is a long white body. The white day opens sharply lower, under the trading range of the previous day. The price comes up to where it closes above the 50% level of the black body.
Hammer Hanging Man Hammer and Hanging-man are candlesticks with long lower shadows and small real bodies. The bodies are at the top of the trading session. This pattern at the bottom of the down-trend is called a Hammer. It is hammering out a base. The Japanese word is takuri, meaning “trying to gauge the depth”.
Morning Star The Morning Star is a bottom reversal signal. Like the morning star, the planet Mercury, it foretells the sunrise, or the rising prices. The pattern consists of a three day signal.
Evening Star The Evening Star is the exact opposite of the morning star. The evening star, the planet Venus, occurs just before the darkness sets in. The evening star is found at the end of the uptrend.
Shooting Star Shooting Star sends a warning that the top is near. It got its name by looking like a shooting star. The Shooting Star Formation, at the bottom of a trend, is a bullish signal. It is known as an inverted hammer. It is important to wait for the bullish verification. Now that we have seen some of the basic signals, let’s take a look at the added power of some of the other formations.

Major Signals Educational Package

Act Today and receive Over 8 hours of video tutorials on The 12 Major Signals for only $12.00

(retails in our site for over $500)

 Limited One Time Offer for a small $12 processing fee!

PLUS – 30-day Free Trial Membership if ordered today

Next – Basics of Japanese Candlesticks    Go to Products on Trading Candlesticks

Training Tutorial

Candlestickforum Flash Cards  These unique Flash Cards will allow you to be “trading like the Pro’s” in no time.