Currency futures are transferable futures contracts that specify the price at which a specific currency can be bought or sold at future date. These contracts allow the forex investor to hedge against foreign exchange risk. With this type of currency, the investor is able to close out of their position and exit from the obligation to buy or sell the currency prior to the contract’s delivery date.
In today’s article we discuss terminology that you may come across when learning about forex and futures.
Futures Contracts
Futures contracts are agreements to buy or sell a particular commodity or financial instrument at a pre-set price in the future. This contract contains the quality and quantity of the underlying asset and some futures contracts call for the physical delivery of the asset. Most however are settled in cash. When learning about currency futures you should also learn about the foreign exchange risk mentioned above. There are two pieces to the foreign exchange risk. First, it is the risk of an investment’s value changing due to changes in currency exchange rates. Second, there is the risk that an investor will have to close out of a long or short position (see short selling) in a foreign currency at a loss due to adverse movements in exchange rates.
Currency Forward
A currency forward is a forward contract in the forex market that locks in the price at which an entity can buy or sell a currency on a future date. The currency forward is also referred to as an outright forward currency transaction or forward outright or FX forward. These contracts are non transferable. Spot Exchange Rate – this is the rate of a foreign exchange contract for immediate delivery. These rates represent the price at which a buyer expects that he or she will pay for a foreign currency in another currency.
Currency Pair
The currency pair is the how the pricing structure of currency futures are traded in the forex market. The actual value of a currency is determined by its comparison to another currency. The first currency of a currency pair is referred to as the base currency and the second currency is referred to as the quote currency. The currency pair shows how much of the quote currency is needed to purchase one unite of the base currency when forex trading.
There is a lot more to learn about as it relates to currency futures. Not only do you need to understand the forex market but you must also understand the futures market as well.
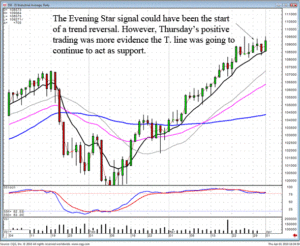
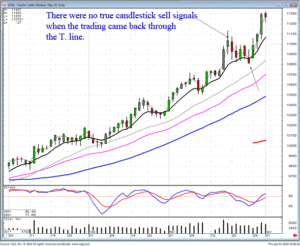
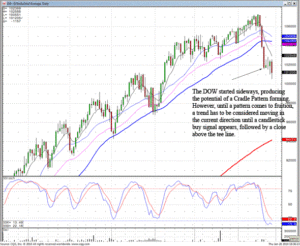
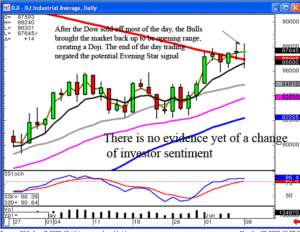
The Nasdaq has been up 12 days in a row. It has done this eight times since 1986. The result is higher moves afterwards on a longer-term basis. However, with the big price move in the market today, this exuberant buying needs to be watched carefully over the next few days. On a short-term basis, be watching for a candlestick ‘sell’ signal. Obviously, this has been a very profitable trend for those that were cognizant of what should happen after a cradle pattern. If the markets show more exuberant buying tomorrow, definitely be prepared for a profit-taking reversal. A gap up tomorrow would warrant setting profit taking stops immediately.
How do you take emotions out of your investment decisions? By knowing what each signal and pattern illustrate. The expected result of a Cradle pattern has kept us in this uptrend until we see a candlestick reversal signal. Today’s exuberant buying prepares us for a possible candlestick sell signal. Candlestick signals and patterns provide a visual map of the direction of the markets. The more you can utilize the maps, the less guesswork or emotional decision-making you will do.
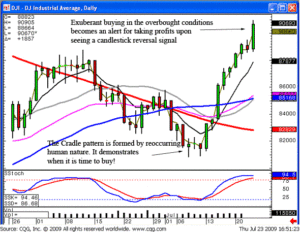
DOW
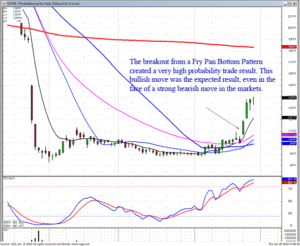
Why do candlestick patterns work? They are the reoccurring representation of what occurs in investor sentiment. The reason they are recognized is because of the predicted results occurring after a pattern/signal is witnessed. As illustrated in our recent recommendation of VCI, there were expected results if a Fry pan bottom pattern shows a breakout. The formation of the pattern was the result of investor sentiment slowly turning positive, eventually reaching to the exuberant stage. If you always return to the basic description of a candlestick signal or pattern, you will trade with much more calmness. Candlestick signals are formed by the accumulative knowledge of everybody buying or selling during a certain time frame.
Unless you have access to a huge research department, the individual trader cannot know what is going on in every company. However, it has to be assumed that there are some people that follow specific companies/sectors will they very high degree of interest. The candlestick signals provide a visual thermometer of what the smart money is going. As seen in the VCI chart, the development of a Fry pan bottom pattern was the result of waning investor interest slowly building back up. The Candlestick Forums recommendation to buy the stock on July 16 was based upon the potential of a Fry Pan Bottom breakout.
Will there are always be a Fry pan bottom breakout? Not always, but there is an extremely high percentage probabilty that makes this chart pattern extremely valuable to learn.
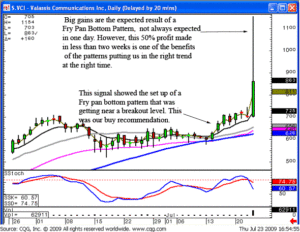
VCI
The confirmation of a Fry pan bottom breakout is very easy to view. It is instigated by a gap up or a big trading day coming out of the level where the Fry Pan Bottom pattern started. This allows for excellent timeliness for option trades. That creates extremely good opportunities for option trading. First, it allows an investor to immediately enter option trades before most investors recognize a new dynamic had come into the price. Secondly, because the pattern has been so lethargic for the previous three weeks/3 months/6 months, the price of the options are usually very low.
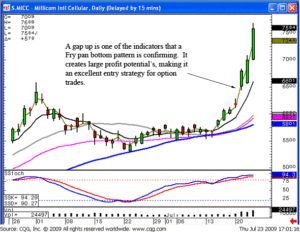
MICC
Do you want to learn how to trade options correctly? Then first learn how to identify when the big price moves will occur using candlestick analysis. Once you have achieved that, then you can apply very simple and correct option trading strategies. This is not rocket science. This is merely common sense put into a graphic depiction.
Good investing,
The Candlestick Forum Team
